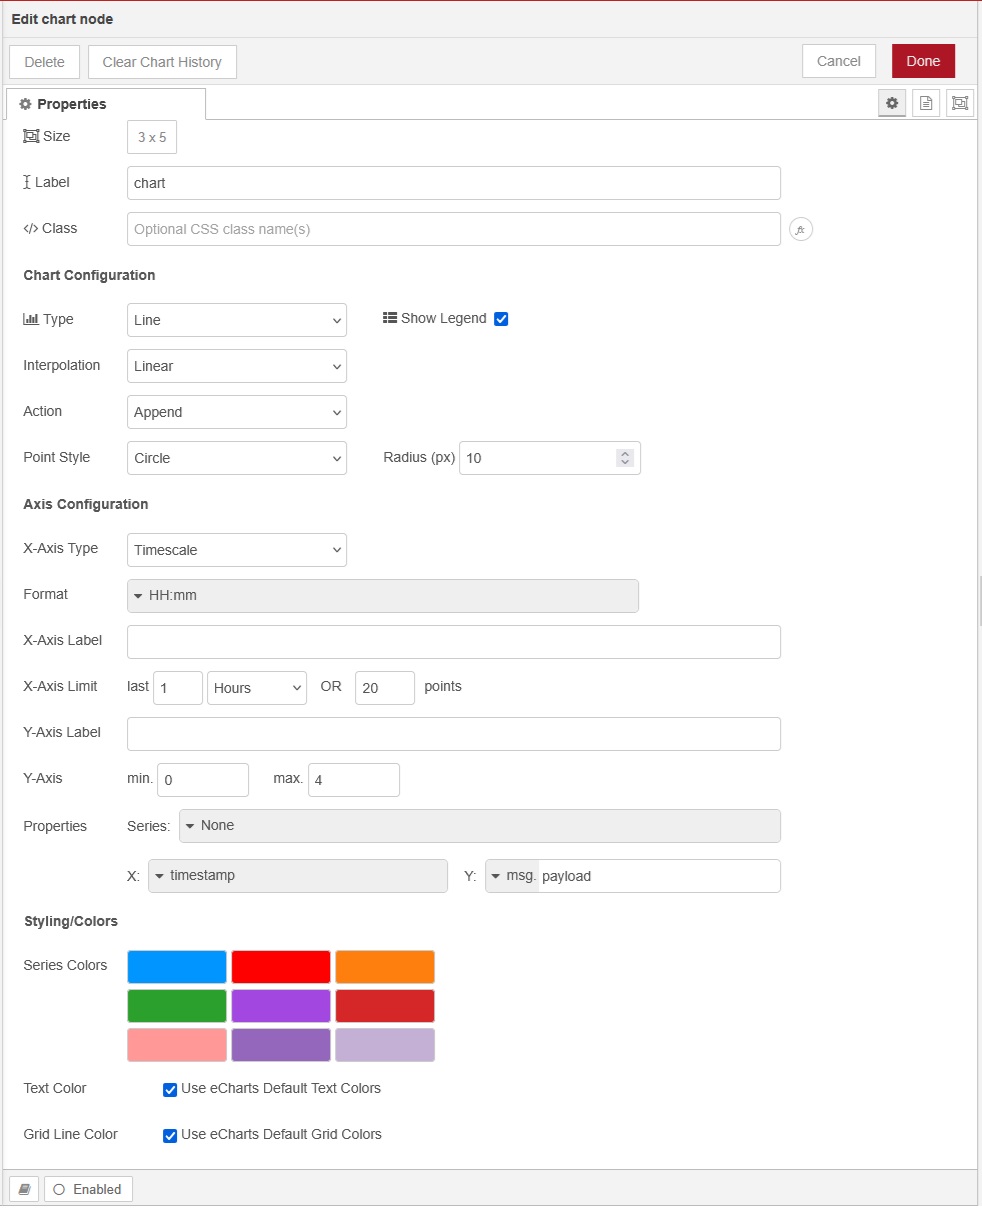
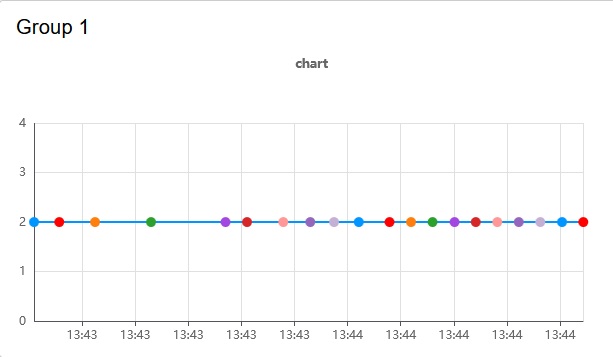
I have found a solution: the selection for Properties: Series should be "NONE".
Then I have a nice single color line.
Can you show us how the chart is configured now please, and tell us what you had in the Series field previously? I want to check whether there is a bug there.
Can you select the inject and chart nodes and export and paste them here please, so that we can try to replicate the problem?
This way?
[
    {
        "id": "7b2befb6ea2b9d9d",
        "type": "ui-chart",
        "z": "e4af61b6bed14a3b",
        "group": "971780555e73f287",
        "name": "",
        "label": "chart",
        "order": 1,
        "chartType": "line",
        "category": "",
        "categoryType": "none",
        "xAxisLabel": "",
        "xAxisProperty": "",
        "xAxisPropertyType": "timestamp",
        "xAxisType": "time",
        "xAxisFormat": "",
        "xAxisFormatType": "{HH}:{mm}",
        "xmin": "",
        "xmax": "",
        "yAxisLabel": "",
        "yAxisProperty": "payload",
        "yAxisPropertyType": "msg",
        "ymin": "0",
        "ymax": "4",
        "bins": 10,
        "action": "append",
        "stackSeries": false,
        "pointShape": "circle",
        "pointRadius": "10",
        "showLegend": true,
        "removeOlder": 1,
        "removeOlderUnit": "3600",
        "removeOlderPoints": "20",
        "colors": [
            "#0095ff",
            "#ff0000",
            "#ff7f0e",
            "#2ca02c",
            "#a347e1",
            "#d62728",
            "#ff9896",
            "#9467bd",
            "#c5b0d5"
        ],
        "textColor": [
            "#666666"
        ],
        "textColorDefault": true,
        "gridColor": [
            "#e5e5e5"
        ],
        "gridColorDefault": true,
        "width": "3",
        "height": "5",
        "className": "",
        "interpolation": "linear",
        "x": 870,
        "y": 340,
        "wires": [
            []
        ]
    },
    {
        "id": "7b3d9ebe6e681e1d",
        "type": "inject",
        "z": "e4af61b6bed14a3b",
        "name": "",
        "props": [
            {
                "p": "payload"
            }
        ],
        "repeat": "2",
        "crontab": "",
        "once": true,
        "onceDelay": 0.1,
        "topic": "",
        "payload": "2",
        "payloadType": "num",
        "x": 730,
        "y": 340,
        "wires": [
            [
                "7b2befb6ea2b9d9d"
            ]
        ]
    },
    {
        "id": "971780555e73f287",
        "type": "ui-group",
        "name": "Group 1",
        "page": "3f2c174003ae29c4",
        "width": "3",
        "height": 1,
        "order": 1,
        "showTitle": true,
        "className": "",
        "visible": "true",
        "disabled": "false",
        "groupType": "default"
    },
    {
        "id": "3f2c174003ae29c4",
        "type": "ui-page",
        "name": "Page 1",
        "ui": "36321428c4348ec0",
        "path": "/page1",
        "icon": "home",
        "layout": "grid",
        "theme": "7061b9268c29c944",
        "breakpoints": [
            {
                "name": "Default",
                "px": 0,
                "cols": 3
            },
            {
                "name": "Tablet",
                "px": 576,
                "cols": 6
            },
            {
                "name": "Small Desktop",
                "px": 768,
                "cols": 9
            },
            {
                "name": "Desktop",
                "px": 1024,
                "cols": 12
            }
        ],
        "order": 1,
        "className": "",
        "visible": "true",
        "disabled": "false"
    },
    {
        "id": "36321428c4348ec0",
        "type": "ui-base",
        "name": "My Dashboard",
        "path": "/dashboard",
        "appIcon": "",
        "includeClientData": true,
        "acceptsClientConfig": [
            "ui-notification",
            "ui-control"
        ],
        "showPathInSidebar": false,
        "headerContent": "page",
        "navigationStyle": "default",
        "titleBarStyle": "default",
        "showReconnectNotification": true,
        "notificationDisplayTime": 1,
        "showDisconnectNotification": true,
        "allowInstall": false
    },
    {
        "id": "7061b9268c29c944",
        "type": "ui-theme",
        "name": "Default Theme",
        "colors": {
            "surface": "#ffffff",
            "primary": "#0094CE",
            "bgPage": "#eeeeee",
            "groupBg": "#ffffff",
            "groupOutline": "#cccccc"
        },
        "sizes": {
            "density": "default",
            "pagePadding": "12px",
            "groupGap": "12px",
            "groupBorderRadius": "4px",
            "widgetGap": "12px"
        }
    },
    {
        "id": "feefc0c38dafec53",
        "type": "global-config",
        "env": [],
        "modules": {
            "@flowfuse/node-red-dashboard": "1.29.0"
        }
    }
]
Close, but the backticks should have been on separate lines in the post.
When using the chart like that should provide the series name in, for example, msg.topic. Specify msg.topic for Series and add a msg.topic with a series name into the Inject node and it should be ok.
Reconsider this "solution", it's not helping you.
Actually I realise there is no need to do that. If you only have one line to draw then set Series to a string containing the series name, and you don't need to provide msg.topic.
That's right, but i think that unless msg.topic exists, contains at least an empty string, the legend will not show up.
If so then that is a bug I think.
I have changed the entry after Series in string and entered NUMBER in there and now the dots are the same color as the line. And NUMBER is displayed.
And, BTW, in the inject node I removed the msg.topic entry and it still works...
I've try an inject node with a msg.topic. Result is the same.
But as soon as I select for series NONE the dotcolor changes
Don't do that. You have a series so give it a name.
For the record, there is a bug in the chart code causing this not to work. The error occurs when using the array definition for Series, but with only a single series, so ["mw","anotherSeries"] works but ["mw"] does not. See Chart node will not show historical data with single series using ["series"] syntax in Series field · Issue #1975 · FlowFuse/node-red-dashboard · GitHub
I am working on a fix now.