Dashboard 2: ui-control node multiple connect/change/lost events

Hello:

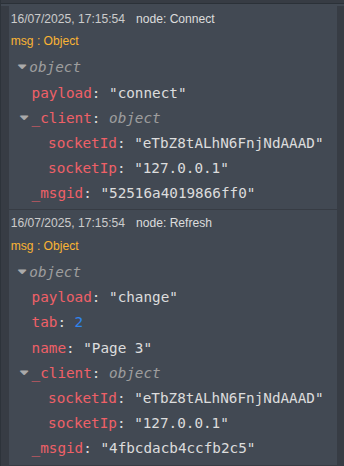
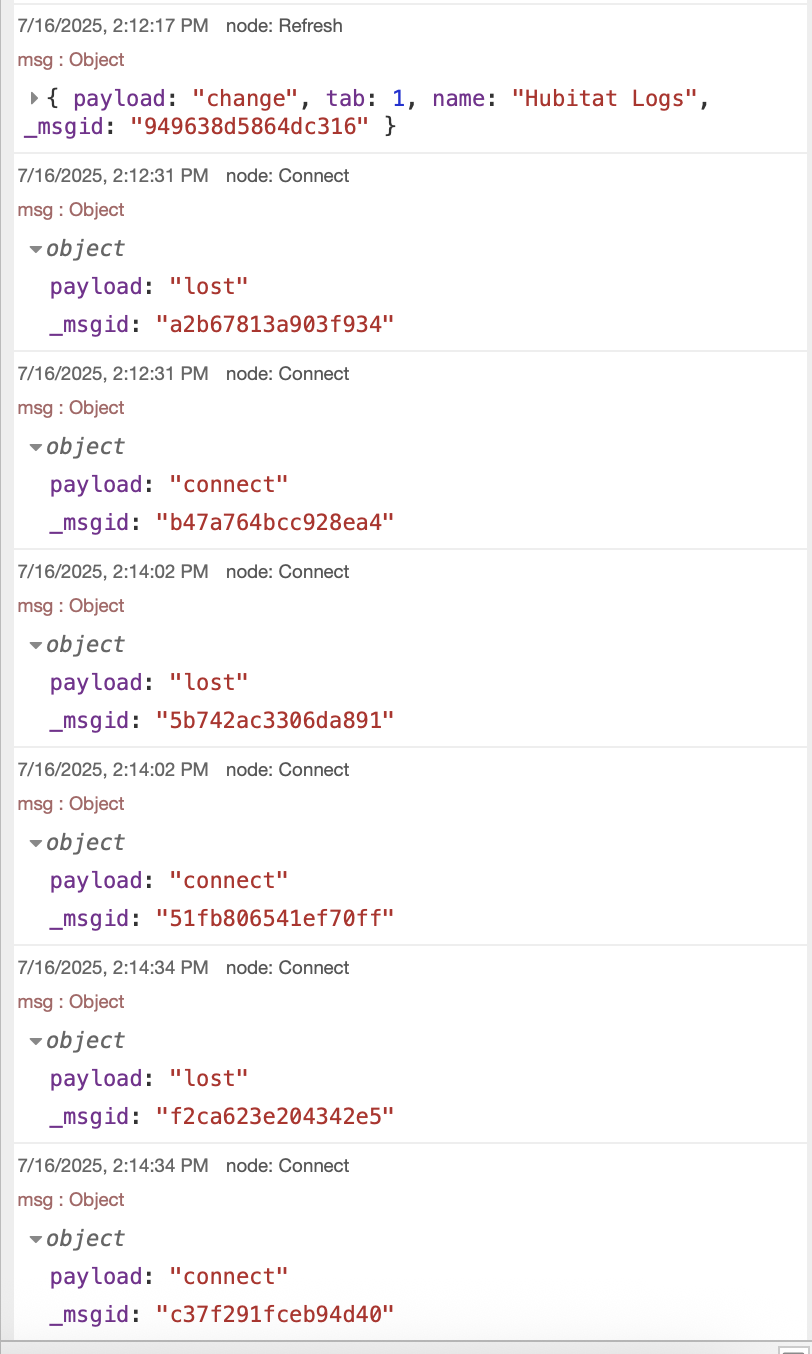
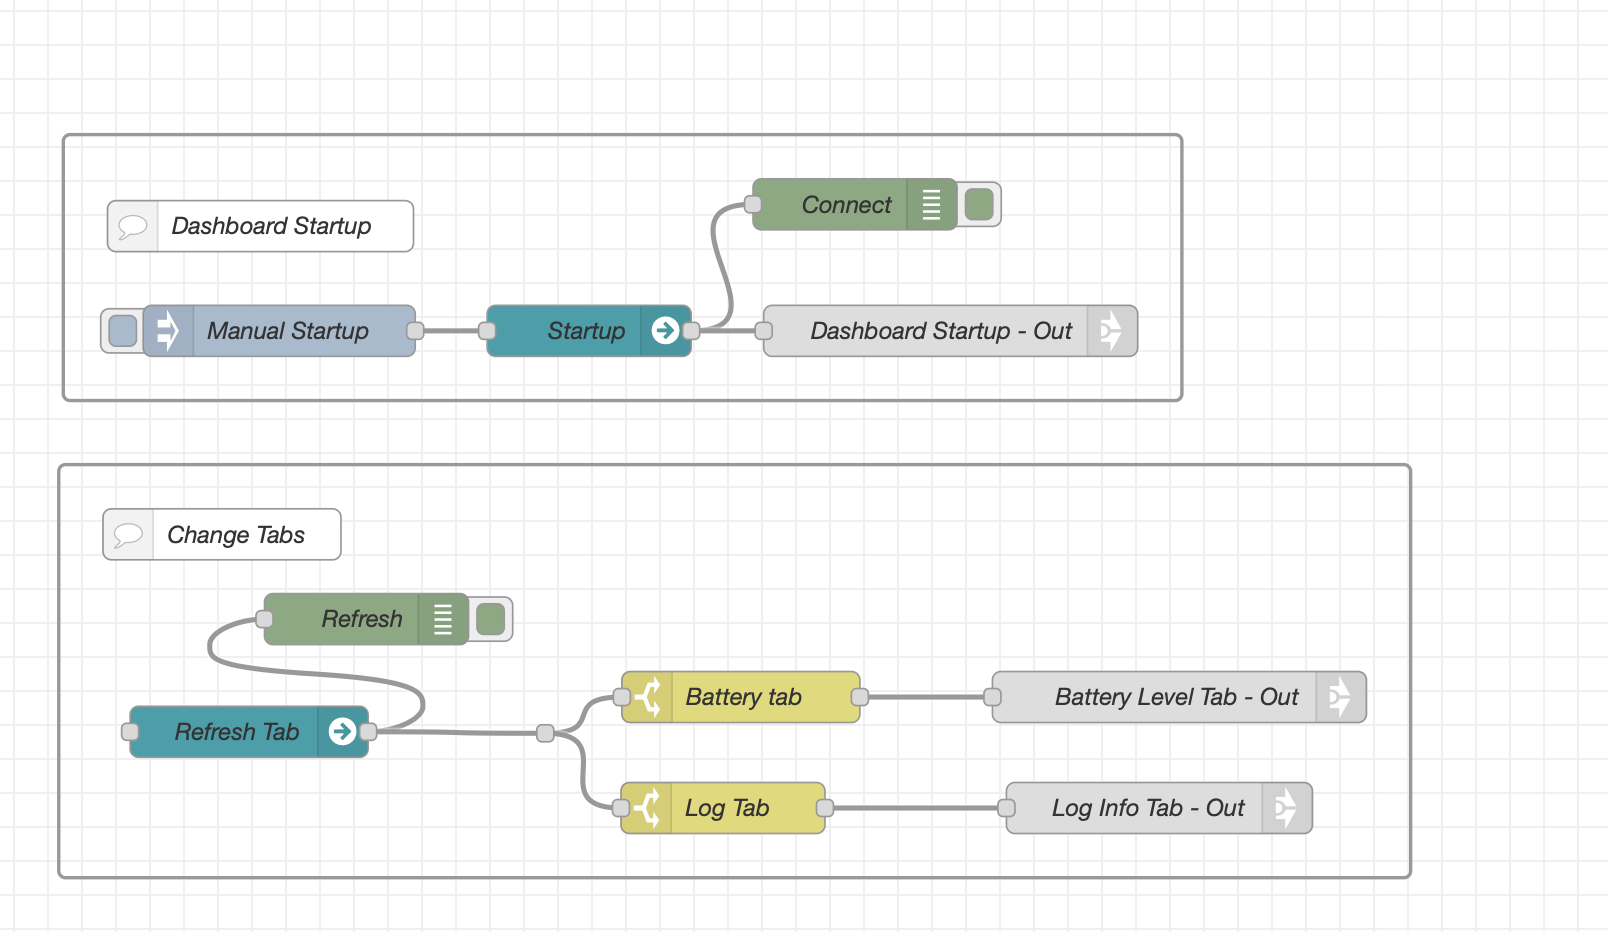
Converting from DB1 to DB2... I have a ui-control node that is set to "Connection Events Only" (name = Connect) and another one "Page/tab Change Events Only" (name = Refresh Tab). What appears to happen is that every "connect" event is followed by a "change" event. Then the connection drops (ui-control node emits a "lost" payload) immediately followed by another "connect" and "change", essentially triggering the flow twice. See debug output below:

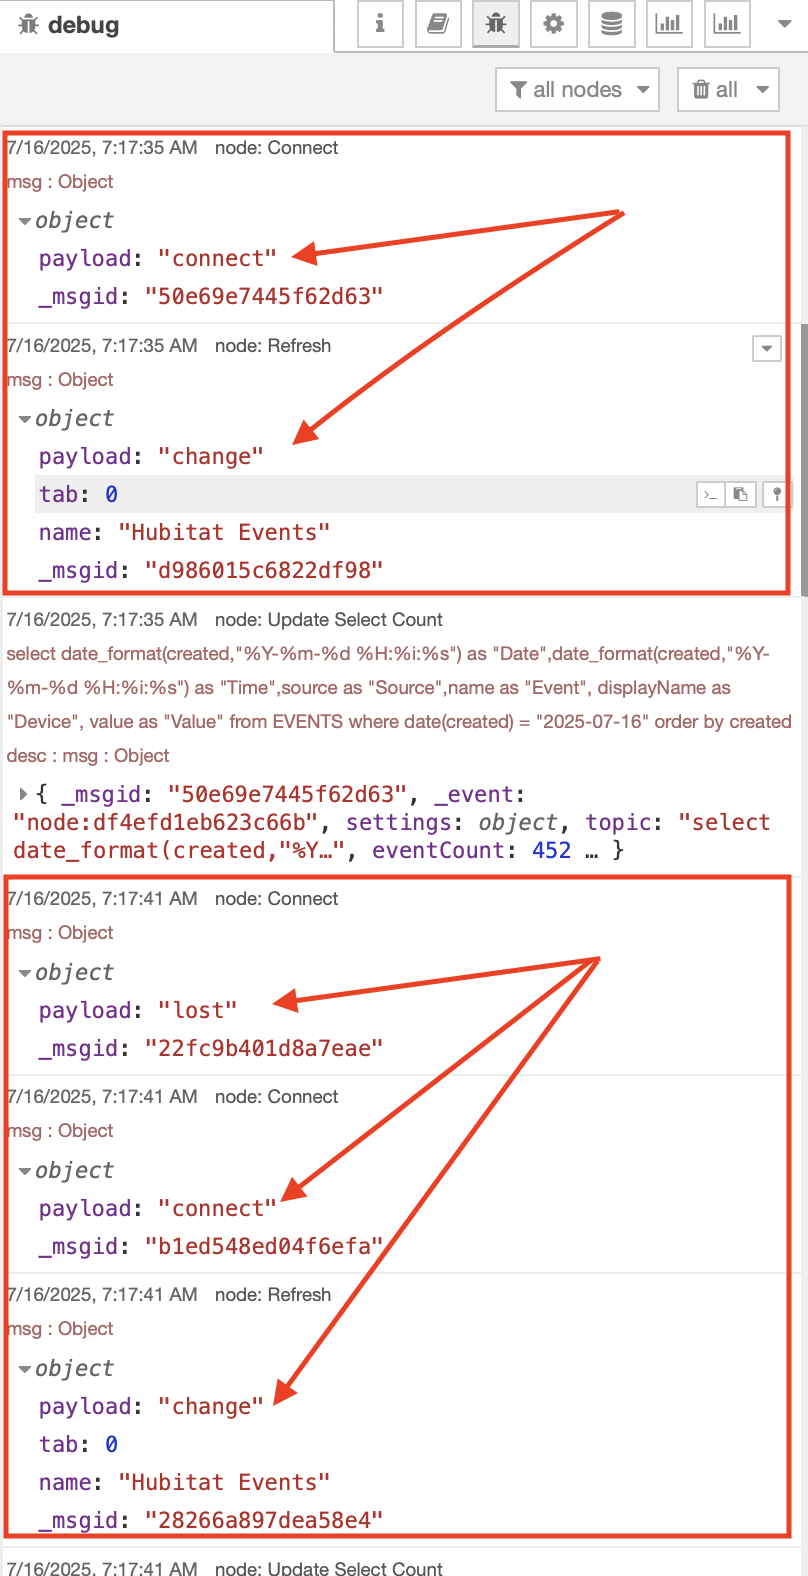
Is this expected behavior (connect followed by change)? Also, what would cause the "lost" connection and how do I troubleshoot this? Thanks for your help

[{"id":"f13e35c22de01c0f","type":"inject","z":"3c0c33a32557141e","name":"Manual Startup","props":[{"p":"payload"},{"p":"topic","vt":"str"}],"repeat":"","crontab":"","once":false,"onceDelay":0.1,"topic":"","payload":"","payloadType":"date","x":222.33334350585938,"y":191.00000953674316,"wires":[["c4fe837b4b2c93bf"]]},{"id":"c4fe837b4b2c93bf","type":"ui-control","z":"3c0c33a32557141e","name":"Startup","ui":"de5759a313e7ad79","events":"connect","x":412.64703369140625,"y":190.86947631835938,"wires":[["0044f01175b23393","8c5731ed8d47e18d"]]},{"id":"8c5731ed8d47e18d","type":"debug","z":"3c0c33a32557141e","name":"Connect","active":true,"tosidebar":true,"console":false,"tostatus":false,"complete":"true","targetType":"full","statusVal":"","statusType":"auto","x":558.06982421875,"y":120.82720947265625,"wires":[]},{"id":"392b9dff111841c1","type":"ui-control","z":"3c0c33a32557141e","name":"Refresh Tab","ui":"de5759a313e7ad79","events":"change","x":1136.6471252441406,"y":60.873138427734375,"wires":[["6dd64b6ebf6cdee9"]]},{"id":"6dd64b6ebf6cdee9","type":"debug","z":"3c0c33a32557141e","name":"Refresh","active":true,"tosidebar":true,"console":false,"tostatus":false,"complete":"true","targetType":"full","statusVal":"","statusType":"auto","x":1314.1875,"y":47.82720947265625,"wires":[]},{"id":"de5759a313e7ad79","type":"ui-base","name":"Node-RED Dashboard","path":"/dashboard","appIcon":"","includeClientData":false,"acceptsClientConfig":["ui-notification","ui-control"],"showPathInSidebar":false,"headerContent":"dashboard","navigationStyle":"fixed","titleBarStyle":"default","showReconnectNotification":true,"notificationDisplayTime":5,"showDisconnectNotification":true,"allowInstall":true}]

EDIT: Node-RED v 4.0.9
MacOS:15.5
Node.js: 22.15.0

I would expect to see the Connect followed by a Change, as the client has connected and then opened that tab. I would not expect to see the disconnect, and I don't see that when I run your flow on my system.

What version of @flowfuse/node-red-dashboard are you running. If it is not the latest (1.25.0) then update that, restart node-red and try again.

If you are already running the latest, when it reconnects is it connecting with a different socketID in the _client object?

If you look in the node-red log do you see the two connects?

What are you doing to cause the initial connection?

1 Like

Hold on, there is stuff missing from your debug output. It should look like this

1 Like

@Colin - I am running 1.25.0 of @flowfuse/node-red-dashboard

That is strange - I don't see the "client" object in my debug. Is DB2 multi-tenancy on by default or is it something that has to be enabled? I imported my old flows but on a fresh install of Node-RED (running it standalone on my local laptop), so maybe that has something to do with it?

OK - that makes sense, I think I can adjust my flows to be triggered by the "change" message.

I can't get it to happen now either. There is some weird scenario where one of my flows is going into a loop so maybe that was causing it. Still trying to figure out was is going on.:thinking:

I beleive there is a setting in the dashboard node or sidebar to turn on/off client data Building Multi-Tenant Dashboards | Node-RED Dashboard 2.0

1 Like

I got the disconnect (but no "connect") in the logs. I took out the debug node, so don't know if there was something else there.

The strange thing is that this seems to happen when I am loading data into a ui-tabulator table. However a different page with an almost identical flow (also populating a ui-tabulator table) seems to work just fine.

EDIT: I did have the debug node but I was filtering on "current flow" so did not see it. I see multiple "lost" and "connect" events in the debug panel :frowning:

I would have expected Transport Error to mean there is some sort of networking issue causing the connection to be dropped and restored, but maybe that error can occur for other reasons.

Run top or other system monitor on the server and see if the CPU is being maxed out temporarily.

1 Like

I’m running it local on my laptop. The problem seems to be with that one page. If I change pages and go to another one, it does seem to work. I’m going to let it be overnight and look at it again tomorrow. Hopefully, it will be something simple. Thanks again for all your help.

In the example you posted you are not actually doing anything when the page is switched. In your real flow are you taking action when that page is selected? It may be that which is triggering the connection dropout. Try disconnecting the ui-control nodes from the action and see if that stops the dropout.

1 Like

Actually that is one of the problems that I'm having. The ui-control node is on a separate flow and on tab change, it is supposed to trigger a particular flow, depending on the tab name (determined in a switch node which is connected to a link-out node). The problem is that the link-in node never gets triggered.

So far, I have manually been triggering the flow with an inject node.

Is the switch node sending anything?

1 Like

Aargh - I feel really stupid now :pensive_face:. I thought I had tried a debug after the switch node. Turns out I had an extra space in my tab name! And that appears to have fixed the disconnect issue (not sure why but will test some more). Thanks so much for your help.

@Colin - I wonder if the disconnects were related to this? https://discourse.nodered.org/t/node-red-dashboard-2-table-tabulator-problems-when-loading-data/98225/2

Only if you are sending massive amounts of data across.

About 5000 to 7000 rows of data (5 columns of text data - max 100 chars, 2 columns of date/time). It was never a problem in DB1.

Yes that is probably the issue then. The fix in the other issue should sort it.

Is that amount of data really usable in the dashboard?

1 Like

The dashboard-2 nodes ui control and event sometimes behave differently when moving to a page (tab) from another dashboard tab,
In my applications, I use them only for connect/disconnect events add a little template which sets listeners and gets load & view events directly from the page:

<script>
function init() {
// Do your stuff here
  console.log("Page is fully loaded");
}
if (document.readyState === "complete")
  init();
else
  window.addEventListener("load", init);

document.addEventListener("visibilitychange", () => {
  if (document.visibilityState === "visible") {
    // User has returned to the tab, do your stuff here
    console.log("Welcome back to the page");
  }
});
</script>

1 Like

It's a log from my home automation system and it allows a user to filter by event type(s) and device(s) for a selected date. It is used mainly for troubleshooting since the built-in logging of the home automation platform is somewhat limited.

In my DB1 application, I used the connect/disconnect events only. The first connect event initiated the flow to load the data for the first page. Hence I was confused with the change/tab event essentially triggering the flow again. For now, I have changed it to trigger based on tab name and that seems to be working so far.

Thanks for the heads up - I will continue to monitor to see if it does strange things.

Do the filtering in the server so that only a subset of data are sent to the browser

1 Like