My dashboard is really slow when loaded. It takes a long time to load and sometimes it errors out. I have a lot of global variables since I am reading many PLCs and displaying information to a table. I have two charts that have roughly 4000 points each. I also have 5 dynamic SVG display. Is it possible that it could be slow due to global variables being too many?
Mostly the chart is the reason. To test it, you can just disable some node's even one by one or some and see the difference.
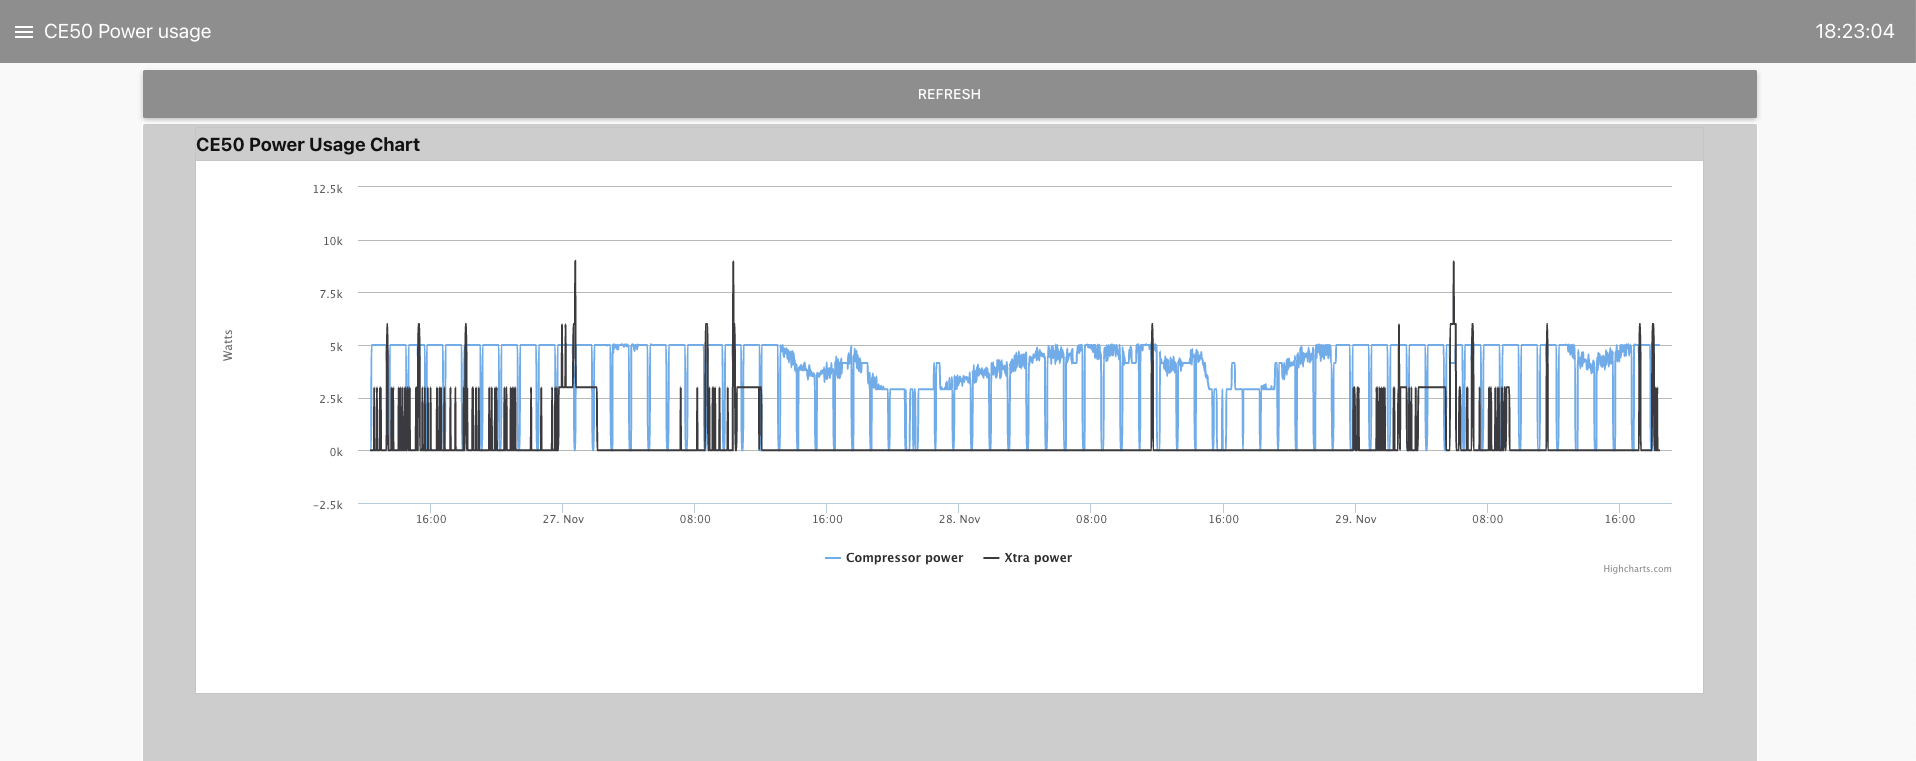
If you have many datapoints, you need to find another solution. I am myself using Highcharts but also other recommendations have been suggested. Anyway, Highcharts is fast and nice, you can read here how to use it in NR:
The exampe below is from my heatpump, I do not know exactly how many datapoints it is in there but it is not slow at all
Do you mean a line with 4000 dots across it, or a number of lines totalling 4000. If the former then unless you have a very large screen there is no point in having that many. I suggest reducing that number, by slowing down the chart update rate if it is real time.
Thank you @Colin @hotNipi @krambriw for your reply. I removed the graphs but it's the same thing when loading the dashboard. it just times out. I have this issue mainly the next day after restarting Node-Red. I have this always running and the next day when I come to work, I am unable to load the dashboard unless I restart the Node-red in my Pi.
I have so many PCCC nodes to read my Allen bradely PLCs. Can this be the reason?
You said previously that it was very slow to load and sometimes it times out. Now you say that the next day it will not load at all.
Exactly what error are you seeing?
Can you load the editor in the browser?
Check the node-red log on the server.
Also check the CPU and memory usage on the server.
Yes, it's true that the dashboard loads very slowly and the next day it does not load at all. The error I get is connection time out. I am able to load the editor without any issue, it is just the dashboard. I believe it's something to do with my Ping nodes. The CPU usage is about 30-40%. Let me fix my ping nodes and give it a day to see what happens.
What hardware and what process is using the CPU? 40% is a lot.
Check it when it is working normally and when it is not.
I am using Raspberry Pi 4 with 4GB Ram and 64GB sd. I fixed all my Ping nodes and it seems to load the dashboard way faster now. The CPU usage is shown between 10-20% now. The only thing I changed in my Ping node was to set the protocol to automatic and change the Ping time to 20s from 5s. No protocol was set for it from before.
Were some of the pings to non accessible devices?
How many ping nodes and how many disconnected?
If you put them back to 5 secs does it go slower again?
I have about 55 ping nodes and 5 were inaccessible due to machines being down. Changing back to 5 secs does slow it down a bit.
Ping nodes?? Why?
55 ping nodes all firing at the same time? That's 55 spawned processes.
Put all devices into am array and use 1 ping node. (read the built in help of node-red-node-ping)
Also, are you running dashboard on the same pi? Can you close browser on oi and connect remotely to dashboard to see if is any better?
Also consider what you are doing downstream of the pings. Are you doing anything that consumes resources?
Part of the issue may also be to do with the failing pings, they will be hanging network processes while they wait for a timeout which may be part of the problem. Steve is right, do them all in one node so they happen one after another rather than all at once.
If the need is to check if devices are alive or not, you could alternatively use nmap (most likely you have to install it). I use this command below and it gives virtually no cpu load while it is running. It will provide you with a list of hosts on your network, in my case any ip within 192.168.0.1 - 254
sudo nmap -sn --privileged -R --system-dns 192.168.0.1-254
If your devices are sending messages within "reasonable time", another method is to use any message received as a "proof of life" of the device and fire a warning if messages are not received within a predefined time frame
Thank you all for the help!
I use the ping nodes to show the status of the machine. The PCCC nodes help me see if the machine is stopped or running, while the ping node tells me if the machine has power or if the PLC is unreachable. All is I am reading is "false" and write to a global variable that is shown on a table. As of now, the dashboard is running really good with RPI CPU jumping between 5-20%. If I have issues tomorrow, I will try to add all the IPs in an array and send it to one ping node. I am avoiding the array right now due to the number of changes I will have to make.
Update: I have not had any issues with loading the dashboard last two days. I also changed it to one ping node and sorted the output by the IP address. The CPU load is still sometimes high but that might be due to the communication with over 60 PLCs.
Again, thank you all for the help!