Hello everyone,
Searching in the forum for post about graphs and found this thread.
i'm using dashboard 2 and the chart node.
my flow is simple as below, generating 3 numbers and set the topic for each.
[
    {
        "id": "bcec8084ca96a7c2",
        "type": "ui-chart",
        "z": "83d956278f9f3685",
        "group": "9004f5edd0e95e52",
        "name": "",
        "label": "chart 3",
        "order": 2,
        "chartType": "line",
        "category": "topic",
        "categoryType": "msg",
        "xAxisLabel": "x label",
        "xAxisProperty": "",
        "xAxisPropertyType": "timestamp",
        "xAxisType": "category",
        "xAxisFormat": "",
        "xAxisFormatType": "auto",
        "xmin": "",
        "xmax": "",
        "yAxisLabel": "y label",
        "yAxisProperty": "payload",
        "yAxisPropertyType": "msg",
        "ymin": "0",
        "ymax": "",
        "bins": 10,
        "action": "append",
        "stackSeries": false,
        "pointShape": "circle",
        "pointRadius": "4",
        "showLegend": true,
        "removeOlder": "3",
        "removeOlderUnit": "3600",
        "removeOlderPoints": "500",
        "colors": [
            "#0095ff",
            "#ff0000",
            "#ff7f0e",
            "#2ca02c",
            "#a347e1",
            "#d62728",
            "#ff9896",
            "#9467bd",
            "#c5b0d5"
        ],
        "textColor": [
            "#666666"
        ],
        "textColorDefault": true,
        "gridColor": [
            "#e5e5e5"
        ],
        "gridColorDefault": true,
        "width": "6",
        "height": "5",
        "className": "",
        "interpolation": "smooth",
        "x": 1010,
        "y": 1100,
        "wires": [
            []
        ]
    },
    {
        "id": "31cddf47a8477dd4",
        "type": "random",
        "z": "83d956278f9f3685",
        "name": "",
        "low": "1000",
        "high": "800",
        "inte": "false",
        "property": "payload",
        "x": 460,
        "y": 1020,
        "wires": [
            [
                "1494e29ad94063a2"
            ]
        ]
    },
    {
        "id": "6388f53450f758b8",
        "type": "inject",
        "z": "83d956278f9f3685",
        "name": "",
        "props": [
            {
                "p": "timestamp",
                "v": "object",
                "vt": "date"
            }
        ],
        "repeat": "1",
        "crontab": "",
        "once": false,
        "onceDelay": 0.1,
        "topic": "",
        "x": 150,
        "y": 1100,
        "wires": [
            [
                "31cddf47a8477dd4",
                "4e7b079075a8388b",
                "a614216567bb667e"
            ]
        ]
    },
    {
        "id": "4e7b079075a8388b",
        "type": "random",
        "z": "83d956278f9f3685",
        "name": "",
        "low": "400",
        "high": "500",
        "inte": "false",
        "property": "payload",
        "x": 460,
        "y": 1100,
        "wires": [
            [
                "48aaa827dbfc873d"
            ]
        ]
    },
    {
        "id": "a614216567bb667e",
        "type": "random",
        "z": "83d956278f9f3685",
        "name": "",
        "low": "420",
        "high": "480",
        "inte": "false",
        "property": "payload",
        "x": 460,
        "y": 1180,
        "wires": [
            [
                "8683b3520479d214"
            ]
        ]
    },
    {
        "id": "1494e29ad94063a2",
        "type": "change",
        "z": "83d956278f9f3685",
        "name": "",
        "rules": [
            {
                "t": "set",
                "p": "topic",
                "pt": "msg",
                "to": "irradiance",
                "tot": "str"
            }
        ],
        "action": "",
        "property": "",
        "from": "",
        "to": "",
        "reg": false,
        "x": 670,
        "y": 1020,
        "wires": [
            [
                "bcec8084ca96a7c2"
            ]
        ]
    },
    {
        "id": "48aaa827dbfc873d",
        "type": "change",
        "z": "83d956278f9f3685",
        "name": "",
        "rules": [
            {
                "t": "set",
                "p": "topic",
                "pt": "msg",
                "to": "dso setpoint",
                "tot": "str"
            }
        ],
        "action": "",
        "property": "",
        "from": "",
        "to": "",
        "reg": false,
        "x": 670,
        "y": 1100,
        "wires": [
            [
                "bcec8084ca96a7c2"
            ]
        ]
    },
    {
        "id": "8683b3520479d214",
        "type": "change",
        "z": "83d956278f9f3685",
        "name": "",
        "rules": [
            {
                "t": "set",
                "p": "topic",
                "pt": "msg",
                "to": "Pout",
                "tot": "str"
            }
        ],
        "action": "",
        "property": "",
        "from": "",
        "to": "",
        "reg": false,
        "x": 670,
        "y": 1180,
        "wires": [
            [
                "bcec8084ca96a7c2"
            ]
        ]
    },
    {
        "id": "9004f5edd0e95e52",
        "type": "ui-group",
        "name": "Group Name",
        "page": "799cb85d9de3dd81",
        "width": 6,
        "height": 1,
        "order": 1,
        "showTitle": true,
        "className": "",
        "visible": "true",
        "disabled": "false",
        "groupType": "default"
    },
    {
        "id": "799cb85d9de3dd81",
        "type": "ui-page",
        "name": "group3",
        "ui": "fe44d2b524e4d1ed",
        "path": "/page1",
        "icon": "home",
        "layout": "grid",
        "theme": "34d4bfb4554e23c8",
        "breakpoints": [
            {
                "name": "Default",
                "px": "0",
                "cols": "3"
            },
            {
                "name": "Tablet",
                "px": "576",
                "cols": "6"
            },
            {
                "name": "Small Desktop",
                "px": "768",
                "cols": "9"
            },
            {
                "name": "Desktop",
                "px": "1024",
                "cols": "12"
            }
        ],
        "order": 2,
        "className": "",
        "visible": "true",
        "disabled": "false"
    },
    {
        "id": "fe44d2b524e4d1ed",
        "type": "ui-base",
        "name": "view5",
        "path": "/dashboard",
        "appIcon": "",
        "includeClientData": true,
        "acceptsClientConfig": [
            "ui-notification",
            "ui-control"
        ],
        "showPathInSidebar": true,
        "headerContent": "dashpage",
        "navigationStyle": "default",
        "titleBarStyle": "default",
        "showReconnectNotification": true,
        "notificationDisplayTime": 1,
        "showDisconnectNotification": true,
        "allowInstall": true
    },
    {
        "id": "34d4bfb4554e23c8",
        "type": "ui-theme",
        "name": "Default Theme",
        "colors": {
            "surface": "#ffffff",
            "primary": "#0094ce",
            "bgPage": "#eeeeee",
            "groupBg": "#ffffff",
            "groupOutline": "#cccccc"
        },
        "sizes": {
            "density": "default",
            "pagePadding": "12px",
            "groupGap": "12px",
            "groupBorderRadius": "4px",
            "widgetGap": "12px"
        }
    }
]
the injection is happening with the same inject node, but still the data points are not aligned.
Also the time is not displayed correctly.
I would expect each point to be aligned on the X axis that is the timestamp.
The 3 different series are recognised by msg.topic (3 different topics)
Does the graph node takes more settings somehow to do that ?
If anyone notice the time (ms before epoch) actually are not sorted oldest to newest.
Is there any problem with how i feed the data ?
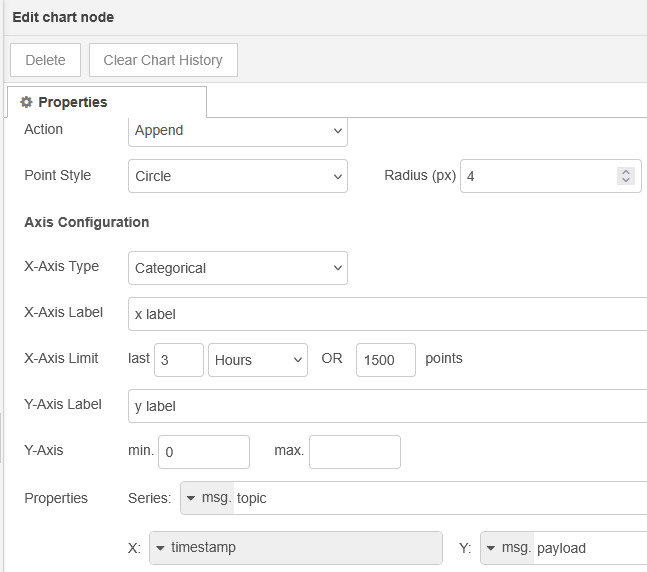
the settings on the graph node are:
My target is to present those values as timeseries from oldest to newest and each data point to get the same vertical point on the graph and show the 3 graphs in parallel. Also to show the time correctly. Any suggestions appreciated.