Dashboard2 ui-chart timeseries colors

Hi,

I have a temperature timeseries ui-chart,
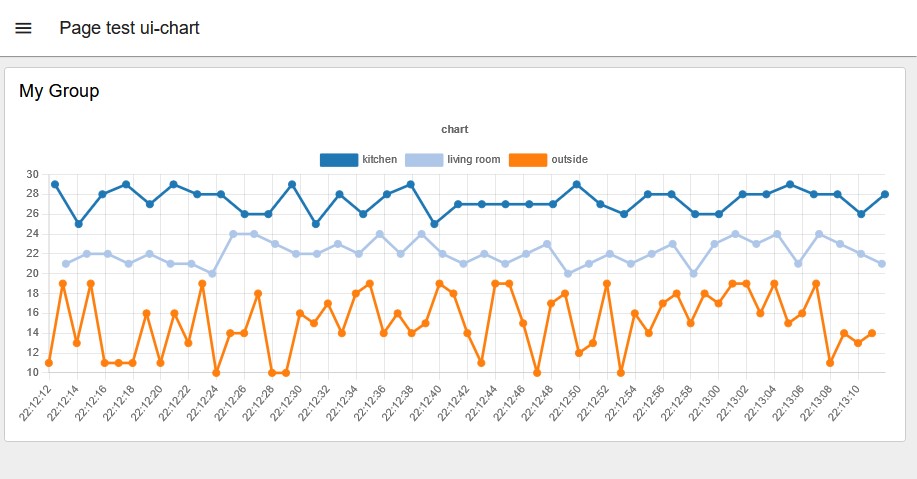
the series is specified by topic, data from the sensors (mqqt) arrive at different timestamps.
Because I don't know which data arrives first when i start, the colors in the ui-chart are always different.

Is it possible to specify the color for the series in the payload?

Attached an example

[
    {
        "id": "236fbb7ba3fbf945",
        "type": "group",
        "z": "54882f66b0e8ee8e",
        "style": {
            "stroke": "#999999",
            "stroke-opacity": "1",
            "fill": "none",
            "fill-opacity": "1",
            "label": true,
            "label-position": "nw",
            "color": "#a4a4a4"
        },
        "nodes": [
            "63aa7e0cd23d44b2",
            "6160c5c434a8d971",
            "4abe0f86f8c45932",
            "248463f482afaee0",
            "8ec51375dc45e70d",
            "7bef089546e0e9f1",
            "07c25d3586b3df20",
            "ae713575410f0f70",
            "999b10424ff13426",
            "14fce2c960d1ad46",
            "2493f68ccd014154"
        ],
        "x": 184,
        "y": 159,
        "w": 702,
        "h": 382
    },
    {
        "id": "63aa7e0cd23d44b2",
        "type": "ui-chart",
        "z": "54882f66b0e8ee8e",
        "g": "236fbb7ba3fbf945",
        "group": "ec6dc23a8a89c2f3",
        "name": "",
        "label": "chart",
        "order": 11,
        "chartType": "line",
        "category": "topic",
        "categoryType": "msg",
        "xAxisProperty": "",
        "xAxisPropertyType": "msg",
        "xAxisType": "time",
        "yAxisProperty": "",
        "ymin": "",
        "ymax": "",
        "action": "append",
        "pointShape": "circle",
        "pointRadius": 4,
        "showLegend": true,
        "removeOlder": 1,
        "removeOlderUnit": "60",
        "removeOlderPoints": "",
        "colors": [
            "#1f77b4",
            "#aec7e8",
            "#ff7f0e",
            "#2ca02c",
            "#98df8a",
            "#d62728",
            "#ff9896",
            "#9467bd",
            "#c5b0d5"
        ],
        "width": "12",
        "height": "6",
        "className": "",
        "x": 810,
        "y": 380,
        "wires": [
            []
        ]
    },
    {
        "id": "6160c5c434a8d971",
        "type": "debug",
        "z": "54882f66b0e8ee8e",
        "g": "236fbb7ba3fbf945",
        "name": "debug 112",
        "active": true,
        "tosidebar": true,
        "console": false,
        "tostatus": false,
        "complete": "false",
        "statusVal": "",
        "statusType": "auto",
        "x": 750,
        "y": 500,
        "wires": []
    },
    {
        "id": "4abe0f86f8c45932",
        "type": "inject",
        "z": "54882f66b0e8ee8e",
        "g": "236fbb7ba3fbf945",
        "name": "",
        "props": [
            {
                "p": "payload"
            },
            {
                "p": "topic",
                "vt": "str"
            }
        ],
        "repeat": "",
        "crontab": "",
        "once": false,
        "onceDelay": 0.1,
        "topic": "",
        "payload": "",
        "payloadType": "date",
        "x": 320,
        "y": 300,
        "wires": [
            [
                "248463f482afaee0"
            ]
        ]
    },
    {
        "id": "248463f482afaee0",
        "type": "function",
        "z": "54882f66b0e8ee8e",
        "g": "236fbb7ba3fbf945",
        "name": "clear",
        "func": "\nmsg.payload =[]\n \n\nreturn msg;",
        "outputs": 1,
        "timeout": 0,
        "noerr": 0,
        "initialize": "",
        "finalize": "",
        "libs": [],
        "x": 510,
        "y": 300,
        "wires": [
            [
                "63aa7e0cd23d44b2"
            ]
        ]
    },
    {
        "id": "8ec51375dc45e70d",
        "type": "comment",
        "z": "54882f66b0e8ee8e",
        "g": "236fbb7ba3fbf945",
        "name": "multi line timeseries chart",
        "info": "",
        "x": 320,
        "y": 200,
        "wires": []
    },
    {
        "id": "7bef089546e0e9f1",
        "type": "function",
        "z": "54882f66b0e8ee8e",
        "g": "236fbb7ba3fbf945",
        "name": "function 70",
        "func": "var min = 10\nvar max = 20\nmin = Math.ceil(min);\n\nmsg.payload = Math.floor(Math.random() * (max - min)) + min;\nmsg.topic = \"outside\"\n\nreturn msg;\n",
        "outputs": 1,
        "timeout": 0,
        "noerr": 0,
        "initialize": "",
        "finalize": "",
        "libs": [],
        "x": 530,
        "y": 380,
        "wires": [
            [
                "63aa7e0cd23d44b2",
                "6160c5c434a8d971"
            ]
        ]
    },
    {
        "id": "07c25d3586b3df20",
        "type": "inject",
        "z": "54882f66b0e8ee8e",
        "g": "236fbb7ba3fbf945",
        "name": "",
        "props": [
            {
                "p": "payload"
            },
            {
                "p": "topic",
                "vt": "str"
            }
        ],
        "repeat": "1",
        "crontab": "",
        "once": false,
        "onceDelay": 0.1,
        "topic": "",
        "payload": "",
        "payloadType": "date",
        "x": 330,
        "y": 380,
        "wires": [
            [
                "7bef089546e0e9f1"
            ]
        ]
    },
    {
        "id": "ae713575410f0f70",
        "type": "function",
        "z": "54882f66b0e8ee8e",
        "g": "236fbb7ba3fbf945",
        "name": "function 71",
        "func": "var min = 20\nvar max = 25\nmin = Math.ceil(min);\n\nmsg.payload = Math.floor(Math.random() * (max - min)) + min;\nmsg.topic = \"living room\"\n\nreturn msg;\n",
        "outputs": 1,
        "timeout": 0,
        "noerr": 0,
        "initialize": "",
        "finalize": "",
        "libs": [],
        "x": 530,
        "y": 440,
        "wires": [
            [
                "63aa7e0cd23d44b2",
                "6160c5c434a8d971"
            ]
        ]
    },
    {
        "id": "999b10424ff13426",
        "type": "inject",
        "z": "54882f66b0e8ee8e",
        "g": "236fbb7ba3fbf945",
        "name": "",
        "props": [
            {
                "p": "payload"
            },
            {
                "p": "topic",
                "vt": "str"
            }
        ],
        "repeat": "2",
        "crontab": "",
        "once": false,
        "onceDelay": 0.1,
        "topic": "",
        "payload": "",
        "payloadType": "date",
        "x": 330,
        "y": 440,
        "wires": [
            [
                "ae713575410f0f70"
            ]
        ]
    },
    {
        "id": "14fce2c960d1ad46",
        "type": "inject",
        "z": "54882f66b0e8ee8e",
        "g": "236fbb7ba3fbf945",
        "name": "",
        "props": [
            {
                "p": "payload"
            },
            {
                "p": "topic",
                "vt": "str"
            }
        ],
        "repeat": "3",
        "crontab": "",
        "once": false,
        "onceDelay": 0.1,
        "topic": "",
        "payload": "",
        "payloadType": "date",
        "x": 330,
        "y": 500,
        "wires": [
            [
                "2493f68ccd014154"
            ]
        ]
    },
    {
        "id": "2493f68ccd014154",
        "type": "function",
        "z": "54882f66b0e8ee8e",
        "g": "236fbb7ba3fbf945",
        "name": "function 72",
        "func": "var min = 25\nvar max = 30\nmin = Math.ceil(min);\n\nmsg.payload = Math.floor(Math.random() * (max - min)) + min;\nmsg.topic = \"kitchen\"\n\nreturn msg;\n",
        "outputs": 1,
        "timeout": 0,
        "noerr": 0,
        "initialize": "",
        "finalize": "",
        "libs": [],
        "x": 530,
        "y": 500,
        "wires": [
            [
                "63aa7e0cd23d44b2",
                "6160c5c434a8d971"
            ]
        ]
    },
    {
        "id": "ec6dc23a8a89c2f3",
        "type": "ui-group",
        "name": "My Group",
        "page": "a33eb8dae09ca4b2",
        "width": "12",
        "height": "6",
        "order": -1,
        "showTitle": true,
        "className": "",
        "visible": "true",
        "disabled": "false"
    },
    {
        "id": "a33eb8dae09ca4b2",
        "type": "ui-page",
        "name": "Page test ui-chart",
        "ui": "a0a3f6b4e20a2ed7",
        "path": "/pagetestUiChart",
        "icon": "home",
        "layout": "grid",
        "theme": "1ad45fa8debfc5ba",
        "order": -1,
        "className": "",
        "visible": "true",
        "disabled": "false"
    },
    {
        "id": "a0a3f6b4e20a2ed7",
        "type": "ui-base",
        "name": "my UI Base",
        "path": "/dashboard",
        "includeClientData": true,
        "acceptsClientConfig": [
            "ui-notification",
            "ui-control"
        ],
        "showPathInSidebar": false
    },
    {
        "id": "1ad45fa8debfc5ba",
        "type": "ui-theme",
        "name": "Default Theme",
        "colors": {
            "surface": "#ffffff",
            "primary": "#0094ce",
            "bgPage": "#eeeeee",
            "groupBg": "#ffffff",
            "groupOutline": "#cccccc"
        },
        "sizes": {
            "pagePadding": "12px",
            "groupGap": "12px",
            "groupBorderRadius": "4px",
            "widgetGap": "12px"
        }
    }
]

This isn't possible currently, but please do raise a feature request

thanks for the information,

it seems, that when the graph shifts the data (i log the temperature for 24h),
the first point that is then plottet in the graph get's the first color,
so i have always different colors for the different traces, what is confusing.
also I don't get the correponding color for the humidity in the second chart.

it would be usefull to have a dedicated color for the trace (topic) either in the configuration of the chart or the payload.

example picture

same chart some time ago

If you add a flow that, at startup, sends a message with each of your topics, in the right order, and with empty payloads, then it should allocate the colours in that order. At least that is how to do it on D1. I haven't tried it on D2

I did this as workaround, but its' useless when the color changes again when time data is shifted.

var msg0 = { "topic": "Aussen Süd", "payload": [] } // clear
var msg1 = { "topic": "Aussen Süd", "payload": 0 }
var msg2 = { "topic": "Wohnzimmer", "payload": 0 }
var msg3 = { "topic": "Bad", "payload": 0 }
var msg4 = { "topic": "2.OG", "payload": 0 }
var msg5 = { "topic": "Aussen Nord", "payload": 0 }

return [[msg0, msg1, msg2, msg3,msg4,msg5]]

return msg;

Can you describe exactly what you mean by that?

I try (my english can be improved :slightly_smiling_face:),

new data is appended to the chart
and X-Axis limit last 1 Days or 1000 points
so old data leaves the chart.

at the time the chart starts, it is undefined which topic is plotted first.

The chart should not restart, points should just drop off the left hand side as they are added to the right hand side.

I don't mean that the chart is restarted,

the pictures above are like you say
"points should just drop off the left hand side as they are added to the right "

in the first temperatue picture the first point is from topic "Aussen Nord" (gets color blue)

in the second temperatue picture (no chart restart!),
the first point is from topic "Aussen Süd" (gets color blue)

so colors for "Aussen Süd" and Aussen Nord" gets changed

(the zigbee temperature sensors do not send data at regular intervals, they send data more often if temperature changes)

Oh, do you mean the colours just suddenly change as you are watching the chart?

yes, i did not restart anything,
it takes some time because chart is 24 hours, but it changes

Could it be that the colours change when the page is refreshed?

yes it seems so,
between the pictures above i did not restart nodered, but I refrehed the page multiple times with F5.
Dashboard was on PC.

I changed the X - axis limit of my test chart to 1 min.
in the browser i can see that it adds points to the right but does not drop points at the left after
1 min or even 1000 points (i waited 20min) ?
only after refreshing the page it drops points and show the correct time range.
the topic which has then the first point in the charts seems to get the first color

Regarding the points, I think that is an issue with the chart widget

https://github.com/FlowFuse/node-red-dashboard/issues/755

If you specify number of points, that is used by "default" instead of time. At least in my current use normally the number of points limits is kept better than the limit by time.

@joepavitt are the colours determined server side or client?
If it is client side might the colours change following a page refresh?

Hi,
thanks for your help,

I limited the points to 60 and changed the injection time,so that they are more random..
The follwing example shows the behaviour.
It drops now the points after 1min and the colors stay ok,
when i refresh (F5) the page, they change.

[
    {
        "id": "63aa7e0cd23d44b2",
        "type": "ui-chart",
        "z": "54882f66b0e8ee8e",
        "g": "236fbb7ba3fbf945",
        "group": "ec6dc23a8a89c2f3",
        "name": "",
        "label": "chart",
        "order": 11,
        "chartType": "line",
        "category": "topic",
        "categoryType": "msg",
        "xAxisProperty": "",
        "xAxisPropertyType": "msg",
        "xAxisType": "time",
        "yAxisProperty": "",
        "ymin": "",
        "ymax": "",
        "action": "append",
        "pointShape": "circle",
        "pointRadius": 4,
        "showLegend": true,
        "removeOlder": "1",
        "removeOlderUnit": "60",
        "removeOlderPoints": "60",
        "colors": [
            "#1f77b4",
            "#aec7e8",
            "#ff7f0e",
            "#2ca02c",
            "#98df8a",
            "#d62728",
            "#ff9896",
            "#9467bd",
            "#c5b0d5"
        ],
        "width": "12",
        "height": "6",
        "className": "",
        "x": 810,
        "y": 380,
        "wires": [
            []
        ]
    },
    {
        "id": "ec6dc23a8a89c2f3",
        "type": "ui-group",
        "name": "My Group",
        "page": "a33eb8dae09ca4b2",
        "width": "12",
        "height": "6",
        "order": -1,
        "showTitle": true,
        "className": "",
        "visible": "true",
        "disabled": "false"
    },
    {
        "id": "a33eb8dae09ca4b2",
        "type": "ui-page",
        "name": "Page test ui-chart",
        "ui": "a0a3f6b4e20a2ed7",
        "path": "/pagetestUiChart",
        "icon": "home",
        "layout": "grid",
        "theme": "1ad45fa8debfc5ba",
        "order": -1,
        "className": "",
        "visible": "true",
        "disabled": "false"
    },
    {
        "id": "a0a3f6b4e20a2ed7",
        "type": "ui-base",
        "name": "my UI Base",
        "path": "/dashboard",
        "includeClientData": true,
        "acceptsClientConfig": [
            "ui-notification",
            "ui-control"
        ],
        "showPathInSidebar": false
    },
    {
        "id": "1ad45fa8debfc5ba",
        "type": "ui-theme",
        "name": "Default Theme",
        "colors": {
            "surface": "#ffffff",
            "primary": "#0094ce",
            "bgPage": "#eeeeee",
            "groupBg": "#ffffff",
            "groupOutline": "#cccccc"
        },
        "sizes": {
            "pagePadding": "12px",
            "groupGap": "12px",
            "groupBorderRadius": "4px",
            "widgetGap": "12px"
        }
    }
]

Regarding the colors, it is an expected behaviour. They are assigned on the client (browser) and thet are assigned by arrival order.

Maybe one way would to be to use a ui-control / ui-event to catch the page load event, and at that time inject a dummy point for all topics.

I do not think this will be expected by the users. I think there should be a way of ensuring that the colours are always the same. In some applications the colours have meaning.

Can the colours change if the user selects a different dashboard page, then returns to the chart page?

I agree.

It should be configured in the message via payload.

The meaning by "expected" is taken in account how the code is currently done. Should have been more explicit.