DB2: Multi-series linear chart help

Hello:

I’m moving a multi-series chart from DB1 to DB2 and am having some trouble. I looked at the example that @joepavitt gave in an earlier thread (https://discourse.nodered.org/t/help-chart-multiple-series-migration-code-d1-to-d2/89328/4) but I think that assumes that the x-axis values are the same for the 3 data points (y-axis).

In my case, the x-axis value (time) could be different for each series (multiple readings at different times within a day for different sensors). I can send both data sets as independent payloads and set the “action” to replace and it works the first time I press the “update” button (that triggers the flow). But then keeps overlaying the data set every time.

Is there a way to chart series with different x-axis (time) and y-axis (lux) values by sending the data in a single payload? Or is there another workaround?

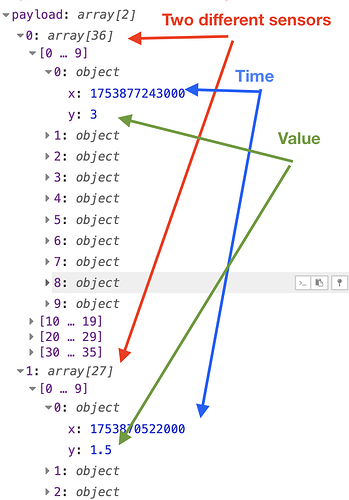
Below is an example of the data that is coming in from the database query:

And in an Inject node:

[{"id":"f8059f5e830498dc","type":"inject","z":"0316cd25d00c5e0d","name":"Sample Chart Data","props":[{"p":"payload"},{"p":"topic","vt":"str"}],"repeat":"","crontab":"","once":false,"onceDelay":0.1,"topic":"","payload":"[[{\"x\":1753877243000,\"y\":3},{\"x\":1753877663000,\"y\":5},{\"x\":1753878563000,\"y\":7},{\"x\":1753879283000,\"y\":9},{\"x\":1753879763000,\"y\":11},{\"x\":1753880003000,\"y\":13},{\"x\":1753881143000,\"y\":11},{\"x\":1753881743000,\"y\":13},{\"x\":1753881923000,\"y\":15},{\"x\":1753882643000,\"y\":17},{\"x\":1753883123000,\"y\":15},{\"x\":1753883603000,\"y\":17},{\"x\":1753883843000,\"y\":19},{\"x\":1753884083000,\"y\":21},{\"x\":1753884803000,\"y\":23},{\"x\":1753885283000,\"y\":25},{\"x\":1753885643000,\"y\":27},{\"x\":1753885943000,\"y\":29},{\"x\":1753886123000,\"y\":31},{\"x\":1753886243000,\"y\":33},{\"x\":1753886543000,\"y\":35},{\"x\":1753886663000,\"y\":37},{\"x\":1753886783000,\"y\":39},{\"x\":1753886903000,\"y\":41},{\"x\":1753887023000,\"y\":43},{\"x\":1753887443000,\"y\":45},{\"x\":1753887563000,\"y\":47},{\"x\":1753887683000,\"y\":49},{\"x\":1753887863000,\"y\":51},{\"x\":1753887983000,\"y\":53},{\"x\":1753888103000,\"y\":55},{\"x\":1753888283000,\"y\":57},{\"x\":1753888523000,\"y\":59},{\"x\":1753889603000,\"y\":61},{\"x\":1753890743000,\"y\":59},{\"x\":1753891823000,\"y\":57}],[{\"x\":1753870522000,\"y\":1.5},{\"x\":1753875443000,\"y\":3},{\"x\":1753875503000,\"y\":2},{\"x\":1753876103000,\"y\":3},{\"x\":1753877183000,\"y\":4},{\"x\":1753877483000,\"y\":5},{\"x\":1753877843000,\"y\":6},{\"x\":1753878203000,\"y\":7},{\"x\":1753878683000,\"y\":8},{\"x\":1753879103000,\"y\":8.67},{\"x\":1753879343000,\"y\":10},{\"x\":1753879703000,\"y\":11},{\"x\":1753880003000,\"y\":12},{\"x\":1753880423000,\"y\":11},{\"x\":1753880843000,\"y\":13},{\"x\":1753881323000,\"y\":15},{\"x\":1753882583000,\"y\":17},{\"x\":1753883903000,\"y\":19},{\"x\":1753885343000,\"y\":21},{\"x\":1753886423000,\"y\":23},{\"x\":1753886723000,\"y\":26},{\"x\":1753886783000,\"y\":23},{\"x\":1753887143000,\"y\":25},{\"x\":1753887443000,\"y\":23},{\"x\":1753888223000,\"y\":25},{\"x\":1753889243000,\"y\":27},{\"x\":1753890803000,\"y\":28.5}]]","payloadType":"json","x":138.6470489501953,"y":141.02756518652345,"wires":[[]]}]

Thanks for your help
You will need to add a series key and reconfigure your data, how you do that depends on where the data comes from. If a DB you could do it in the DB request or use Javascript or JSONata to convert the data and add a series key.
here is an example

[{"id":"f8059f5e830498dc","type":"inject","z":"d1395164b4eec73e","name":"Sample Chart Data","props":[{"p":"payload"},{"p":"topic","vt":"str"}],"repeat":"","crontab":"","once":false,"onceDelay":0.1,"topic":"","payload":"[[{\"x\":1753877243000,\"y\":3},{\"x\":1753877663000,\"y\":5},{\"x\":1753878563000,\"y\":7},{\"x\":1753879283000,\"y\":9},{\"x\":1753879763000,\"y\":11},{\"x\":1753880003000,\"y\":13},{\"x\":1753881143000,\"y\":11},{\"x\":1753881743000,\"y\":13},{\"x\":1753881923000,\"y\":15},{\"x\":1753882643000,\"y\":17},{\"x\":1753883123000,\"y\":15},{\"x\":1753883603000,\"y\":17},{\"x\":1753883843000,\"y\":19},{\"x\":1753884083000,\"y\":21},{\"x\":1753884803000,\"y\":23},{\"x\":1753885283000,\"y\":25},{\"x\":1753885643000,\"y\":27},{\"x\":1753885943000,\"y\":29},{\"x\":1753886123000,\"y\":31},{\"x\":1753886243000,\"y\":33},{\"x\":1753886543000,\"y\":35},{\"x\":1753886663000,\"y\":37},{\"x\":1753886783000,\"y\":39},{\"x\":1753886903000,\"y\":41},{\"x\":1753887023000,\"y\":43},{\"x\":1753887443000,\"y\":45},{\"x\":1753887563000,\"y\":47},{\"x\":1753887683000,\"y\":49},{\"x\":1753887863000,\"y\":51},{\"x\":1753887983000,\"y\":53},{\"x\":1753888103000,\"y\":55},{\"x\":1753888283000,\"y\":57},{\"x\":1753888523000,\"y\":59},{\"x\":1753889603000,\"y\":61},{\"x\":1753890743000,\"y\":59},{\"x\":1753891823000,\"y\":57}],[{\"x\":1753870522000,\"y\":1.5},{\"x\":1753875443000,\"y\":3},{\"x\":1753875503000,\"y\":2},{\"x\":1753876103000,\"y\":3},{\"x\":1753877183000,\"y\":4},{\"x\":1753877483000,\"y\":5},{\"x\":1753877843000,\"y\":6},{\"x\":1753878203000,\"y\":7},{\"x\":1753878683000,\"y\":8},{\"x\":1753879103000,\"y\":8.67},{\"x\":1753879343000,\"y\":10},{\"x\":1753879703000,\"y\":11},{\"x\":1753880003000,\"y\":12},{\"x\":1753880423000,\"y\":11},{\"x\":1753880843000,\"y\":13},{\"x\":1753881323000,\"y\":15},{\"x\":1753882583000,\"y\":17},{\"x\":1753883903000,\"y\":19},{\"x\":1753885343000,\"y\":21},{\"x\":1753886423000,\"y\":23},{\"x\":1753886723000,\"y\":26},{\"x\":1753886783000,\"y\":23},{\"x\":1753887143000,\"y\":25},{\"x\":1753887443000,\"y\":23},{\"x\":1753888223000,\"y\":25},{\"x\":1753889243000,\"y\":27},{\"x\":1753890803000,\"y\":28.5}]]","payloadType":"json","x":210,"y":1920,"wires":[["ad2cd07f4f4fd446"]]},{"id":"ad2cd07f4f4fd446","type":"change","z":"d1395164b4eec73e","name":"","rules":[{"t":"set","p":"payload","pt":"msg","to":"$$.payload#$i.$.$merge([$,{\"series\":$i}])","tot":"jsonata"}],"action":"","property":"","from":"","to":"","reg":false,"x":420,"y":1920,"wires":[["83c94548020a4f29","6b95616c013063c9"]]},{"id":"83c94548020a4f29","type":"ui-chart","z":"d1395164b4eec73e","group":"9d83cd8b3d5ee33c","name":"","label":"chart","order":2,"chartType":"line","category":"series","categoryType":"property","xAxisLabel":"","xAxisProperty":"x","xAxisPropertyType":"property","xAxisType":"time","xAxisFormat":"","xAxisFormatType":"auto","xmin":"","xmax":"","yAxisLabel":"","yAxisProperty":"y","yAxisPropertyType":"property","ymin":"","ymax":"","bins":10,"action":"replace","stackSeries":false,"pointShape":"circle","pointRadius":4,"showLegend":true,"removeOlder":"20","removeOlderUnit":"604800","removeOlderPoints":"1000","colors":["#0095ff","#ff0000","#ff7f0e","#2ca02c","#a347e1","#d62728","#ff9896","#9467bd","#c5b0d5"],"textColor":["#666666"],"textColorDefault":true,"gridColor":["#e5e5e5"],"gridColorDefault":true,"width":6,"height":8,"className":"","interpolation":"linear","x":550,"y":1940,"wires":[[]]},{"id":"6b95616c013063c9","type":"debug","z":"d1395164b4eec73e","name":"debug 5","active":true,"tosidebar":true,"console":false,"tostatus":false,"complete":"false","statusVal":"","statusType":"auto","x":340,"y":1980,"wires":[]},{"id":"9d83cd8b3d5ee33c","type":"ui-group","name":"Group1","page":"c694d0ebe0d2b702","width":"6","height":"1","order":1,"showTitle":true,"className":"","visible":"true","disabled":"false","groupType":"default"},{"id":"c694d0ebe0d2b702","type":"ui-page","name":"Page1","ui":"1805777f90e92057","path":"/page1","icon":"home","layout":"grid","theme":"35ee7753b5b3599b","breakpoints":[{"name":"Default","px":"0","cols":"3"},{"name":"Tablet","px":"576","cols":"6"},{"name":"Small Desktop","px":"768","cols":"9"},{"name":"Desktop","px":"1024","cols":"12"}],"order":1,"className":"","visible":"true","disabled":"false"},{"id":"1805777f90e92057","type":"ui-base","name":"dashboard ","path":"/dashboard","appIcon":"","includeClientData":true,"acceptsClientConfig":["ui-notification","ui-control"],"showPathInSidebar":false,"headerContent":"page","titleBarStyle":"default","showReconnectNotification":false,"notificationDisplayTime":"5","showDisconnectNotification":false},{"id":"35ee7753b5b3599b","type":"ui-theme","name":"Theme Name","colors":{"surface":"#16234b","primary":"#1d44b9","bgPage":"#ecf2f8","groupBg":"#ffffff","groupOutline":"#cccccc"},"sizes":{"density":"default","pagePadding":"12px","groupGap":"12px","groupBorderRadius":"4px","widgetGap":"12px"}}]

Look at the debug output to see how the data was converted and series added. I used the OG array index but you could use any value/name you wish for each series.

1 Like

Ah… so basically concat the two arrays and add a “series” value? I think I can do that in my SQL statement as I was using two separate SQL statements to collect the data and then combine them into an array.

Thank you so much! I was able to do it all in the DB request and eliminated a whole bunch of logic that was in the old dashboard code.

3 Likes

That’s the main reason we got rid of the fixed structure requirement as an input to the ui-chart node!

2 Likes