Hi, I have been using node red for little over a week with no issues regarding the debug window. But since yesterday, basicly out of nowhere (I believe after a regular reboot), no messages pop up in the debug window at all. When I set the debug node to output to the system console, I do receive the messages in the console at full, without errors or issues. Also, the flow functions fully like before.
My setup:
Raspberry pi 5 which runs raspberry OS with node red (standard port 1880)
Laptop too control/setup node red connected through chrome -> wifi (local connection)
What have I tried:
Ofcourse some basics: debug node is active (and working through system console) and the debug window is open (just blank)
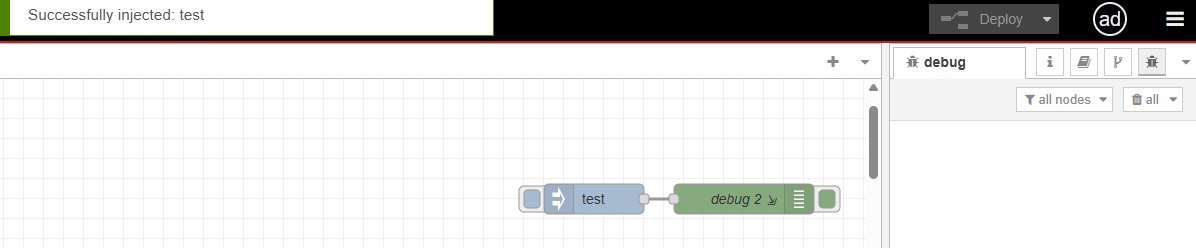
Disable all external nodes and go back to basic inject -> debug
look at every potential forum to find a solution: no luck...
Open console on raspberry through localhost -> same problem
Clear cache of browser (chrome)
Find errors on startup in the console -> no errors (such as websocket)
Find errors in web console; i got some errors but I am not sure if this has any connection with the debug window:
Uncaught (in promise) Error: A listener indicated an asynchronous response by returning true, but the message channel closed before a response was received (I am pretty sure that this is from the node which imports sensordata to node-red)
Uncaught (in promise) Canceled: Canceled
at g.cancel (editor.js:2:597062)
at g.dispose (editor.js:2:597176)
at h (editor.js:2:711061)
at p.clear (editor.js:2:711703)
at p.dispose (editor.js:2:711613)
at B.dispose (editor.js:2:3533212)
at p.value (editor.js:2:3533686)
at m._deliver (editor.js:2:664165)
at m._deliverQueue (editor.js:2:664271)
at m.fire (editor.js:2:664606)
Is there someone who has an idea how to fix this? It could be something stupid which I missed, I am by no means an expert. Please let me know if some additional information is required. Thanks in advance!
Have you made any changes to settings.js?
What does node-red --version in a terminal on the Pi return?
If the problem persists after a Node-red restart or rebooting the Pi it would be a good idea to reinstall Node-red using the standard Pi install script.
Thanks for the quick reply!
No I cannot see the payload under the node when I tick all three outputs. Below i have added a screenshot of the settings of the debug node.
Yeah, that is not the issue. Initially, I have used a lot of different sources and debug nodes which all have the same problem. I am pretty sure it is a node red problem and not a flow/node problem. Underneath you can find the settings of the inject node.
Update,
For whatever reason, the debug window decided to just start working again after two days of trial and error out of nowhere while I was monitoring the chrome console... I am extremely confused right now. I will continue to monitor the situation and supply you with an update in a couple of days regarding the status.
Thanks to the both of you for your time and effort!