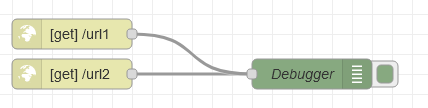
I have two http in nodes, both connected to a debug.
The node that works gives an msg object with all the info one should think should come in.
The other node that is frozen gives nothing, not even an empty object.
Is there anything in node-red to assist with debugging?
Yepp, but there's nothing obvious in the flow.
So im asking, what are the next steps the node-red ninjas would do to debug?
going to url 1 would trigger something to appear in the debugger.
going to url 2 would trigger nothing in the debugger.
It used to be like this, and when it freezes, this is what it gets locked to.
Going to url2 will get you a response from the node with the html in the template, even after you have disconnected the nodes in the flow
So if you set the flow up as in the first picture after it freezes, you will still get the html.
The node will unfreeze if you do certain things, like if you make a copy, the new node will behave correctly.
If you change enough things with the frozen node it will unfreeze.
This is a constant problem we're trying to debug, and all the internet provides is "use debug node" or "use catch node" and neither of those even react when the node freezes.
In your first image, the http-in nodes don't have matching http-out nodes. You MUST have each http-in connected to an http-out. Could be the same http-out if your processing allows it but you HAVE to supply some kind of response to the browser.
No, i do not.
To put it bluntly, the flow is not broken.
Im simply asking for tips to debug beyond "the flow is broken"?
And even when there are 2 http-in nodes with the same name, node-red sends you to one of them.
With the frozen one it doesnt, it just keeps sending you to how it remembers the flow at the time of freezing, regardless of what you do to the flow.
The picture was to show that there is nothing different between the nodes that work and nodes that doesnt, it was mocked up to show as the orginal flow involves links i can't share and by changing the link of the node it will most likely unfreeze.
This is a reoccuring problem, that i can't reproduce on my own, because it doesnt show up when connected to debug nodes, so i am asking for tips to debug beyond the flow.
And when i post this, people keep getting stuck on how my flow is setup, when this occurs even when the singular node is connected correctly to an http-out and that is all there is.
The flow is not broken, it works perfectly fine without anything changed, or deployed, until the point where it no longer works.
Find the node that doesnt work, copy the original node, paste the new node, delete the original node, connect the new node, tada, the flow suddenly works again, even thought the text in the export node function havent changed a character.
As a workaround, leave them connected to debug nodes.
Is your OS fully up to date? If on a Debian based system such as Ubuntu or Pi then run sudo apt update && sudo apt full-upgrade
Are you using the latest version of node-red and all installed nodes?
Stop node red in a command window and start it again and see if there are any unusual startup messages there. If you post the full startup output here we can take a look. Copy/paste please, not screenshot.
You should have explained more up front. Bear in mind that most people asking these kinds of questions don't have much experience - not with Node-RED and often not with IT systems at all. So we will always start debugging from the simplest point since that is the most common to get answers.
The expanded information along with re-reading the original makes it look like a caching issue. If you change the flow but are still getting the old output, something is caching the data. This will be outside Node-RED almost certainly. Try, after a freeze, make and commit a change and stop-start Node-RED if you haven't already tried that. If the problem still shows up, it demonstrates that the issue is an external cache.
Bad phrasing on my part, the debug message doesnt show up when connected to debug nodes.
The freezing problem happens when it wants to.
We updated one server to latest, and allthough it seems less frequent, it has happened once on that one.
The other servers are in daily use and not easily upgradeable.
We're a bit touchy on upgrading servers when we know there is an unidentified bug/issue
Ill get back to you on the startup log.
Fair enough, i should have been more explicit in my question.
I can try that, but keep in mind that when the freeze has happened, you can open the node and change settings like the url and it usually unfreezes.
Also copying the node and replacing the original with the copy will fix it.
This is why debugging is tricky, because you'll accidentally fix the problem by just navigating, moving around nodes, and looking into the settings.
You could maybe try using the ExpressJS middleware hook that Node-RED's settings.js exposes. By adding a middleware function that looks for any request for your URL and dumping info to the console, you would be able to see when Node-RED's ExpressJS web server is actually responding to a request. If an external cache is the issue, you wouldn't see a request in the middleware.
You can also do that by turning up the log info level I think but then you get masses of irrelevant info as well.
A quick glance at ExpressJS makes me want to go the info level route, but if you have a suggestion on how to specifically implement the ExpressJS solution im all ears.
In settings.js, there is a httpNodeMiddleware function:
    httpNodeMiddleware: function(req, res, next) {
        // Handle/reject the request, or pass it on to the http in node by calling next();
        // Optionally skip our rawBodyParser by setting this to true;
        // req.skipRawBodyParser = true;

        console.log('httpNodeMiddleware')

        res.setHeader('httpNodeMiddleware', 'true')

        res.setHeader('x-powered-by', 'Node-RED')
        res.setHeader('x-environment', 'Dev Node')

        // Help reduce risk of XSS and other attacks
        res.setHeader('X-XSS-Protection', '1;mode=block')
        res.setHeader('X-Content-Type-Options', 'nosniff')
        // res.setHeader('X-Frame-Options','SAMEORIGIN')
        // res.setHeader('Content-Security-Policy',"script-src 'self'")

        // console.log('USER HEADERS', req.headers)

        next()
    },
That is from my dev PC.
That function is called every time someone uses a URL defined by an http-in node. It is passed the standard ExpressJS res and req objects
As you can see, you can add headers and do some other tweaks on the res object. The res object is finalised when your flow hits the http-out node.
I've just added a simple console.log in the example so that you can at least see if a user accessing the URL has actually made it through into ExpressJS.