Hi expert, I'm using a raspberry for collecting data over serial Port.
What kind of nodes can I use to correctly manage the values to be displayed in the dashboard as a graph?
I need add only 1 or 2 temperatures for understanding the process, the others will be implemented later. I tried many options but l not familiar with java.
Thanks in advance for the advice.
wbr
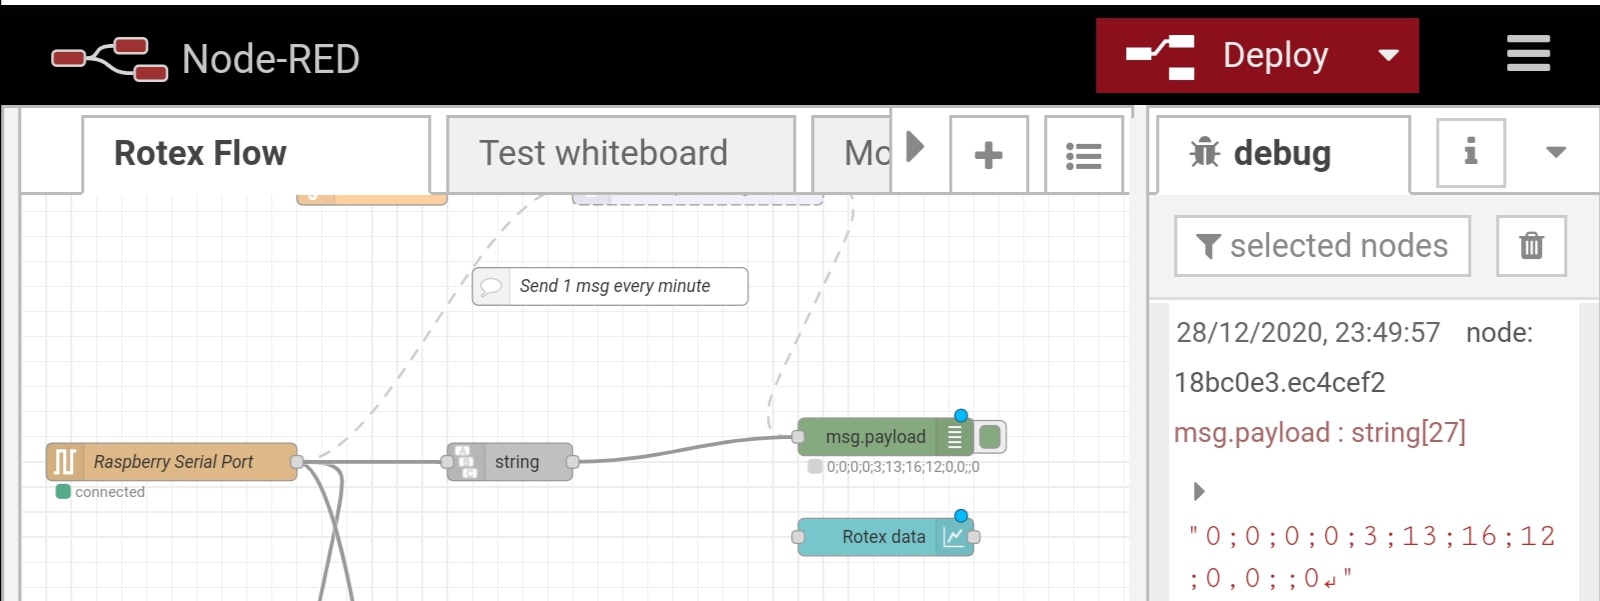
ttyAMA0|690x259
Hi Christian & welcome.
Couple of things...
- You can paste images directly into a reply (no need to upload & link)
- This is not "java" it is JavaScript - the difference is quite substantial.
question...
Are you in control of the serial data? If you are, you would be wise to send data in a mannor that is simple to convert (e.g. in JSON format).
If there is no possiblity of changing the serial data, can you describe the format of the data?
Lastly, have you read the built in help for the ui_chart? You only need to send a topic and payload
So if you try using an inject node first & can get values into the chart then you just need to replace the inject node with your data value.
Hello Steve, thanks for your quick reply.
In the past I used a script in .PHP to send the data on a server.
The data collected are temperature displayed in this way:
0;0;0;0;13;13;16;15;0,0;;0
I'm using the serial input node as the origin of data, I will try to convert in JSON format, which kind of node do you suggest? I'm not so skilled with this platform and the right flow is not clear..
Thanks
