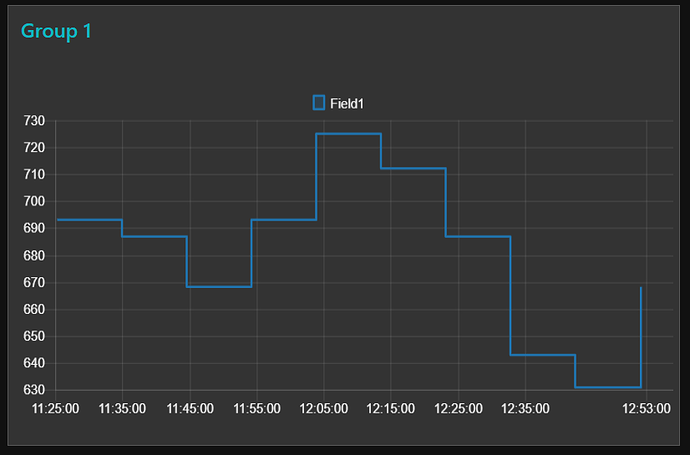
It would be a pretty standard pattern: a jsonata expression to transform the dataset and then a function node to prepare the data array to be charted.
Please check if it works for you.
[{"id":"11fe5226.c1852e","type":"tab","label":"Flow 1","disabled":false,"info":""},{"id":"1f235c13.329e84","type":"ui_chart","z":"11fe5226.c1852e","name":"","group":"2257ffde.e0372","order":0,"width":0,"height":0,"label":"{{msg.label}}","chartType":"line","legend":"true","xformat":"HH:mm:ss","interpolate":"step","nodata":"","dot":false,"ymin":"","ymax":"","removeOlder":"1","removeOlderPoints":"","removeOlderUnit":"3600","cutout":0,"useOneColor":false,"colors":["#1f77b4","#aec7e8","#ff7f0e","#2ca02c","#98df8a","#d62728","#ff9896","#9467bd","#c5b0d5"],"useOldStyle":false,"x":750,"y":200,"wires":[[],[]]},{"id":"f8e76a2d.53a1f8","type":"inject","z":"11fe5226.c1852e","name":"","topic":"","payload":"[]","payloadType":"json","repeat":"","crontab":"","once":false,"onceDelay":0.1,"x":610,"y":200,"wires":[["1f235c13.329e84"]]},{"id":"57b6fd03.409fb4","type":"change","z":"11fe5226.c1852e","name":"Data Array","rules":[{"t":"set","p":"data","pt":"msg","to":"$.feeds.{\"x\":created_at, \"y\" : field1}","tot":"jsonata"}],"action":"","property":"","from":"","to":"","reg":false,"x":410,"y":140,"wires":[["5d6b75fd.a012bc"]]},{"id":"5d6b75fd.a012bc","type":"function","z":"11fe5226.c1852e","name":"Setup payload","func":"series = [];\ndata = [];\nlabels = [];\n\nseries.push(\"Field1\");\nlabels.push(\"Field1\");\ndata.push(msg.data);\n\nmsg.payload = [{\"series\":series, \"data\":data,\"labels\": labels}];\n\nreturn msg;","outputs":1,"noerr":0,"x":580,"y":140,"wires":[["1f235c13.329e84","f7632553.21d7c8"]]},{"id":"78688515.e7a22c","type":"function","z":"11fe5226.c1852e","name":"Dataset","func":"msg = \n\n{\n\"channel\":\n{\n\"id\":\"XXXXXXX\",\"name\":\"temperature sensor\",\n\"description\":\"Temperatura / Prototipo 1 Esp8266 /Sensor /PowerBank / Deepsleep \",\n\"latitude\":\"0.0\",\n\"longitude\":\"0.0\",\n\"field1\":\"Temperatura\",\n\"created_at\":\"2018-09-23T13:26:03Z\",\n\"updated_at\":\"2018-09-29T22:48:56Z\",\n\"last_entry_id\":964\n},\n\n\"feeds\":[\n{\"created_at\":\"2018-10-08T14:25:17Z\",\"entry_id\":955,\"field1\":\"693\"},\n{\"created_at\":\"2018-10-08T14:34:58Z\",\"entry_id\":956,\"field1\":\"687\"},\n{\"created_at\":\"2018-10-08T14:44:36Z\",\"entry_id\":957,\"field1\":\"668\"},\n{\"created_at\":\"2018-10-08T14:54:17Z\",\"entry_id\":958,\"field1\":\"693\"},\n{\"created_at\":\"2018-10-08T15:03:54Z\",\"entry_id\":959,\"field1\":\"725\"},\n{\"created_at\":\"2018-10-08T15:13:35Z\",\"entry_id\":960,\"field1\":\"712\"},\n{\"created_at\":\"2018-10-08T15:23:14Z\",\"entry_id\":961,\"field1\":\"687\"},\n{\"created_at\":\"2018-10-08T15:32:54Z\",\"entry_id\":962,\"field1\":\"643\"},\n{\"created_at\":\"2018-10-08T15:42:33Z\",\"entry_id\":963,\"field1\":\"631\"},\n{\"created_at\":\"2018-10-08T15:52:13Z\",\"entry_id\":964,\"field1\":\"668\"}\n]\n}\nreturn msg;","outputs":1,"noerr":0,"x":260,"y":140,"wires":[["57b6fd03.409fb4"]]},{"id":"e21cd684.f93dd8","type":"inject","z":"11fe5226.c1852e","name":"Trigger","topic":"","payload":"","payloadType":"date","repeat":"","crontab":"","once":true,"onceDelay":0.1,"x":120,"y":140,"wires":[["78688515.e7a22c"]]},{"id":"f7632553.21d7c8","type":"debug","z":"11fe5226.c1852e","name":"","active":true,"tosidebar":true,"console":false,"tostatus":false,"complete":"true","x":750,"y":140,"wires":[]},{"id":"2257ffde.e0372","type":"ui_group","z":"","name":"Group 1","tab":"7ca87b7b.b32a64","disp":true,"width":"12","collapse":false},{"id":"7ca87b7b.b32a64","type":"ui_tab","z":"","name":"Tab1","icon":"dashboard"}]


