Hi! We want to connect and display specific data or cells from our excel/CSV file into a chart and text in node-red. We also need to make a separate chart for each row.
Can you please help us? Thank you so much!


It's not clear what node you are using to open the excel file, but if you are using node-red-contrib-spreadsheet-in then there should be a sample in your sample directory and with this sample it should be easy to get started.
If it's just a csv file then the file in node (as you have) followed by a csv node will split up the lines into separate messages. If you then need 5 charts you will need to direct each to their own chart - you cannot auto generate an unknown number of charts - they all need to exist in advance. (so if your file size changes then this won't work).
But then you don't say what type of chart or which data you are trying to plot...
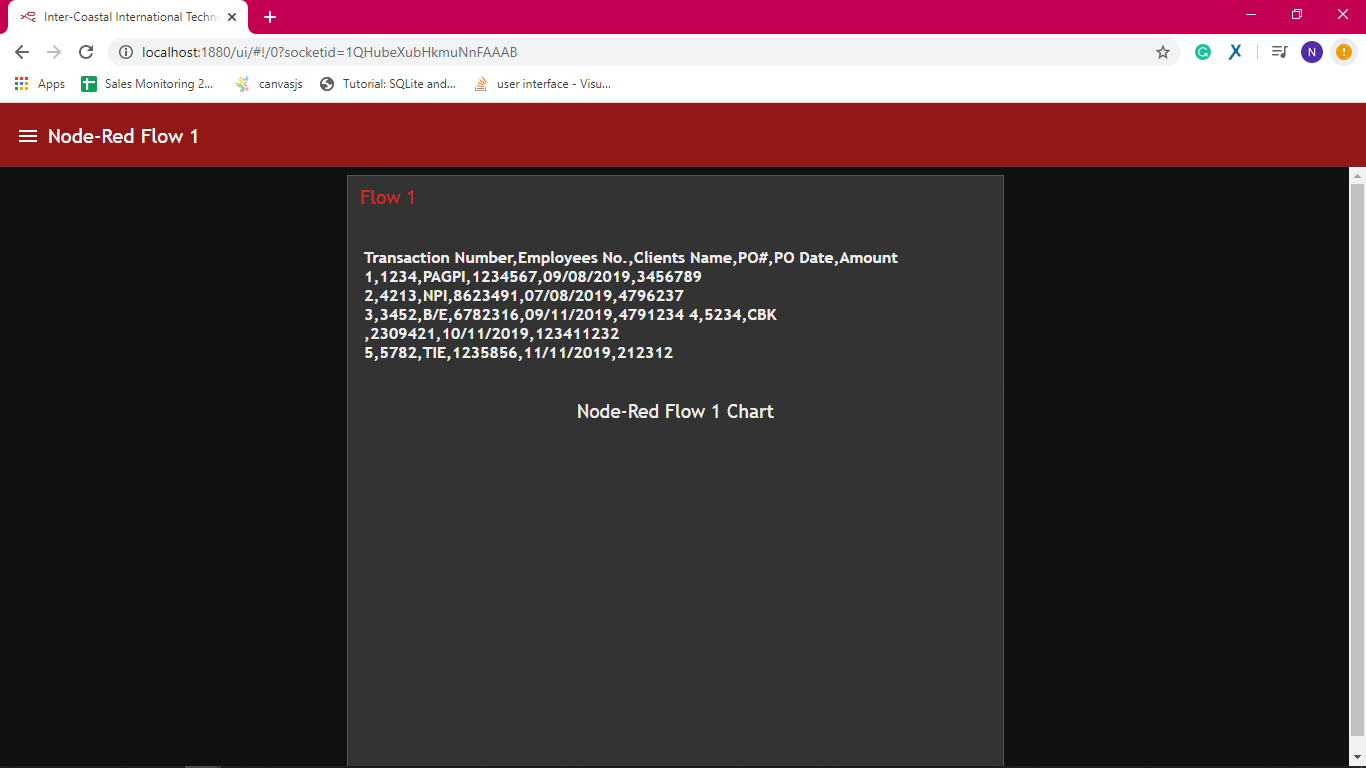
Sorry, I am using a file in node to open my excel file.
I've already installed a node-red-contrib-viseo-google-spreadsheet-in is it okay or I have to uninstall the node-red-contrib-viseo-google-spreadsheet-in first before installing the node-red-contrib-spreadsheet-in? I am worried that it might cause conflict if ever I install it.