Does Node-RED flow execution run faster than debug or UI updates like counters?

In my Node-RED flow, I'm noticing that the execution seems to happen faster than what is shown in the UI, such as in the debug panel or flow dashboard. For example, in a delay node, the counter seems to count up to the maximum value first, and only then starts counting down. Similarly, in a semaphore node, it seems like the flow executes faster than the semaphore or counter values are updated in the UI.

Are there any known issues or limitations around flow execution speed vs. visual updates in Node-RED? If so, are there best practices to ensure that the UI/debug output reflects real-time flow execution more accurately?

Thanks in advance!

[
    {
        "id": "126579a8ffc1a561",
        "type": "tab",
        "label": "Flow 2",
        "disabled": false,
        "info": "",
        "env": []
    },
    {
        "id": "a7473374bbbf2b69",
        "type": "inject",
        "z": "126579a8ffc1a561",
        "name": "",
        "props": [
            {
                "p": "payload"
            },
            {
                "p": "topic",
                "vt": "str"
            }
        ],
        "repeat": "",
        "crontab": "",
        "once": false,
        "onceDelay": 0.1,
        "topic": "",
        "payload": "",
        "payloadType": "date",
        "x": 200,
        "y": 140,
        "wires": [
            [
                "13c16fc29acfe07b"
            ]
        ]
    },
    {
        "id": "a5a1f48989e4919d",
        "type": "delay",
        "z": "126579a8ffc1a561",
        "name": "",
        "pauseType": "delay",
        "timeout": "2",
        "timeoutUnits": "seconds",
        "rate": "1",
        "nbRateUnits": "1",
        "rateUnits": "second",
        "randomFirst": "1",
        "randomLast": "5",
        "randomUnits": "seconds",
        "drop": false,
        "allowrate": false,
        "outputs": 1,
        "x": 540,
        "y": 240,
        "wires": [
            [
                "060ce61290c094cb"
            ]
        ]
    },
    {
        "id": "060ce61290c094cb",
        "type": "debug",
        "z": "126579a8ffc1a561",
        "name": "debug 301",
        "active": false,
        "tosidebar": true,
        "console": false,
        "tostatus": false,
        "complete": "false",
        "statusVal": "",
        "statusType": "auto",
        "x": 850,
        "y": 240,
        "wires": []
    },
    {
        "id": "13c16fc29acfe07b",
        "type": "function",
        "z": "126579a8ffc1a561",
        "name": "function 87",
        "func": "// Create an array to hold the messages\nlet messages = [];\n\n// Loop 1000 times to generate messages\nfor (let i = 0; i < 10000; i++) {\n    // Create a message with a payload\n    let msg = {\n        payload: `Message number: ${i + 1}`\n    };\n\n    // Add the message to the array\n    messages.push({ ...msg });\n}\n\n// Return the array of messages, which sends all at once\nreturn [messages];\n",
        "outputs": 1,
        "timeout": 0,
        "noerr": 0,
        "initialize": "",
        "finalize": "",
        "libs": [],
        "x": 310,
        "y": 240,
        "wires": [
            [
                "a5a1f48989e4919d"
            ]
        ]
    }
]

The flow will execute as fast as it can.

updates to the web client (hte editor) will occur soon after - via a web-scoket so there can be a discernible delay in the update comething through - however this is only a visualisation. What happens at the backend (in the flows) always works as it should.

Occationaly, depending on how much/how frequenet the updates are (like debug messages, status node updates), they will be matched.

If you have LOTS of debug nodes with fast moving messages, it could impact flow speed execution (while it prepares and posts the status to the connected clients) - so i would recommend you dont have too many debug nodes outputting large messages at high speed (disable them or delete them once you have stable flows)

any shortcuts to disable all the debugs in the flows ?

Switch them all off - Yes. CTRL-SHIFT-P, Deactivate All Debug Nodes

chrome_g1YRZYqabj

Disable them - yes. Select them, CTRL-SHIFT-P, Disable Selected Nodes

chrome_qFuX927edg

1 Like

Thanks,

Is there a difference between disable and deactivate then it comes to the performance?

I've not checked. I suppose the flow start up time is slightly faster when disabled (since disabled nodes are not instantiated)

Are you actually having performance issues?

I get a feeling that the rendering of counters etc is impacting the performance of flow execution when I am processing 1000s of messages. I will see if I can setup some minimum example as a test and see if that the case.

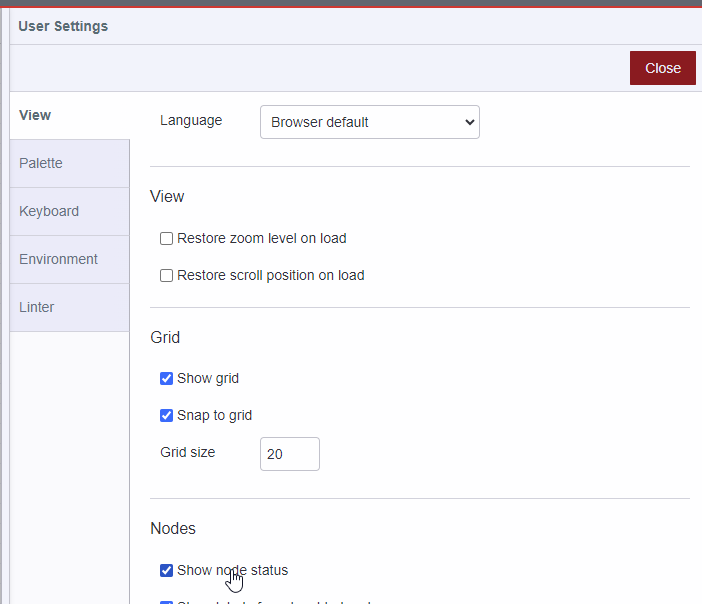
You can disable node-statuses in Node-RED settings

you can also run without the editor open... :slight_smile:
(it is not a dashboard, etc... )

1 Like

What hardware is node red running on, and is the browser running in the same machine? If you are running a browser and node-red on a low power machine then the browser may be clobbering the system. Generally the browser will take a lot more CPU than node-red.

I've run it on the same machine + browser using Docker on a Macbook Air M2 (so a rather powerful machine). But my feeling is that the rendering of counters is what takes time. Specifically I have the behaviour when queueing requests using the Semaphore node - so that nodes implementation might affect the behaviour extra much.

True, every packet sent to the ui via the web socket has to be unpacked, checked, and ackd. Some of the core nodes like delay node deliberately only send status updates only 3 times a second with the latest value rather than every single value. I don’t know what the semaphore node does.