Hi !
I am desperately in need of help with creating a network map with ui-template dashboard.
the input is a payload, like this:
{"nodeId":207253600,"root":true,"subs":[{"nodeId":3178927348,"subs":[{"nodeId":3178927464,"subs":[{"nodeId":3178932996}]},{"nodeId":2577528556}]}]}
The result should be a graphical representation of the nodes, showing the total number of nodes and the connections between nodes and their subnodes, like a directory tree stucture.
Any help highly appritiated !
You should use a 3rd-party graph library (don't mix up charts and graphs, graphs are interconnected nodes, charts are representations of mostly numeric data).
This is my Obsidian note on the subject:
| Name |
Descr |
$ |
Comments |
| baklavajs |
Graph/node editor for VueJs |
0 |
Interesting Unreal engine style flow-based display and processing. |
| beautiful-react-diagrams |
React components and hooks to build diagrams |
|
|
| butterfly |
Renderer for interactive diagrams and flowcharts |
|
|
| cytoscape.js |
Canvas based renderer with utilities and algorithms |
|
blog |
| diagram-maker |
Interactive editor for any graph-like data |
0 |
Online editor |
| Flowy |
Flowchart library |
0 |
Flowcharts only |
| flow-builder |
React-based renderer for workflows and process diagrams |
|
|
| Flume |
A React-powered node editor and runtime engine |
0 |
Unreal engine style flow-based display and processing. |
GoJS |
Diagramming library with a focus on customization and interactivity |
$$$ |
Go library |
jointjs |
JavaScript diagramming library |
$$$ |
|
jsplumb |
Open source project written in Typescript that gives you the tools you need to visually connect DOM elements |
0 (Limited), $$$ |
Free version is too limiting |
kedro-viz |
Visualises Kedro data and machine-learning pipelines |
|
Specialist |
| litegraph.js |
A graph node engine and editor |
0 |
Unreal engine style flow-based display and processing. |
| mermaid |
JavaScript based diagramming and charting tool that renders Markdown-inspired text definitions to create and modify diagrams dynamically. |
0 |
Widely embedded in other tools. |
ngx-graph |
Graph visualization library for Angular |
|
Angular only |
| nice-dag |
Lightweight javascript library, which is used to present a DAG diagram |
|
|
| nodl |
Framework for computational node graphs |
0 |
Unreal engine style flow-based display and processing. |
| Pintora |
Extensible javascript text-to-diagrams library that works in both browser and Node.js. Inspired by Mermaid and PlantUML |
0 |
|
| react-dag-editor |
React component to create graphic user interface |
|
|
| react-digraph |
A library for creating directed graph editors |
|
|
| react-flow |
React library for rendering node-based UIs |
|
|
| reaflow |
React library for building workflow editors |
|
|
| rete |
Framework for visual programming and node editors |
0 |
Unreal engine style flow-based display and processing. |
| sigma.js |
Visualization framework for large graphs |
|
|
| vue-flow |
Flowchart component for Vue 3 |
|
Simplified graph view |
| X6 |
X6 is an HTML and SVG-based graph editing engine that provides low-cost customization capabilities and out-of-the-box built-in extensions to quickly build DAG diagrams, ER diagrams, flowcharts, lineage diagrams, and more. |
|
Mostly Chinese. |
Apache ECharts
Website Docs GitHub
Includes Graph types.
Arbor.js
arbor.js » introduction (arborjs.org) samizdatco/arbor: a graph visualization library using web workers and jQuery (github.com)
"a graph visualization library built with web workers and jQuery."
D3.js
Website Docs GitHub
Data visualisation
d3-graphviz
magjac/d3-graphviz: Graphviz DOT rendering and animated transitions using D3 (github.com)
Dracula
strathausen/dracula: JavaScript layout and representation of connected graphs. (github.com) Dracula Graph Library – Graph Computation, Layout, Algorithms for JavaScript (graphdracula.net)
G6 (AntV)
Introduction | G6 (gitee.io)
Graphviz (C)
DOT Language. Command line only.
Vega - Incl Tree & Network views
A Visualization Grammar | Vega
Vis.js (Community Edition) - Incl Network view
vis.js (visjs.org)
A dynamic, browser based visualization library. The library is designed to be easy to use, to handle large amounts of dynamic data, and to enable manipulation of and interaction with the data. The library consists of the components DataSet, Timeline, Network, Graph2d and Graph3d.
VivaGraphJS
website
Layouting
- elkjs - A port of the Java ELK layouting library to Javascript
- d3-hierarchy - Helpers and algorithms for working with hierarchical graphs
- d3-force - Library for creating interactive force directed graphs
- d3-dag - D3 plugin to work with DAG data structures
- dagrejs - Directed graph layout algorithms for Javascript
- graphology-layout - Layout algorithms
- springy - Force directed graph layouts
Graph Utilities
- behave-graph - Extensible behaviour-graph execution engine
- graphlib - Helpers for directed graphs in JS
- graphology - Utilities and algorithms for all kinds of graphs
Misc
- flume - Business logic graph editor
- mermaid - Flowchart and sequence diagrams generation
- pintora - Text-to-diagrams library
- quick-erd - Generate entity-relationship diagrams (ERD) from text, and reverse engineer ERD text from live database
Overview | Welcome to PyFlow homepage! (wonderworks-software.github.io) is a general purpose visual scripting framework for python.
Ryven - Flow-based visual scripting for Python - A simple and powerful visual nodes editor for Python, and a framework for building nodes executing any Python code.
FWIW.
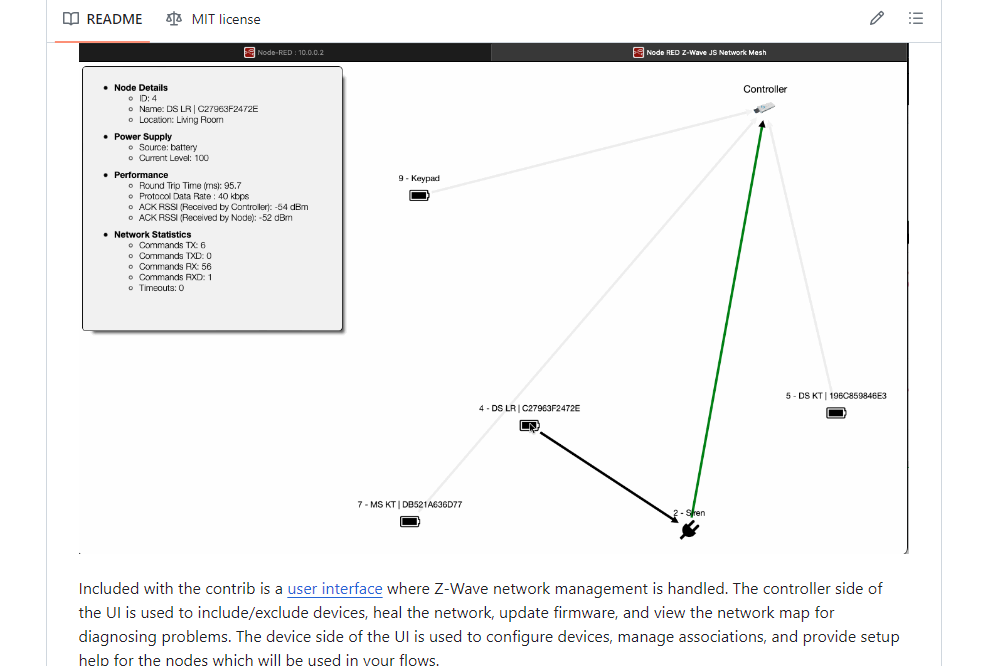
I use cytoscape.js in the list above for my Node RED Zwave Module Mesh map feature
works really well!
Thank you for the tips, but I'am afraid, deploying any those sollutions are above my capabilities