Hi all,
this is my second topic.
I started with a project a few days ago. Thanks to the help of kind people in this forum I was able to implement some features in the project.
Here you can find the beginning of the story:
First Post
A few learnings later I am facing a new problem where I cant get my head around.
What I have so far:
I write accelerometer values from a modbus-device into an mssql db.
I can parse the table content into a line chart

Using the following flow:
[
    {
        "id": "f5c107a16d194936",
        "type": "inject",
        "z": "4e100d14e53b3afc",
        "name": "",
        "props": [
            {
                "p": "payload"
            },
            {
                "p": "topic",
                "vt": "str"
            }
        ],
        "repeat": "",
        "crontab": "",
        "once": false,
        "onceDelay": 0.1,
        "topic": "",
        "payload": "",
        "payloadType": "date",
        "x": 120,
        "y": 540,
        "wires": [
            [
                "8c2ee81a9259c669"
            ]
        ]
    },
    {
        "id": "a4e8711562181b92",
        "type": "function",
        "z": "4e100d14e53b3afc",
        "name": "function 3",
        "func": "//var data = [[{\"x\":1537348236000,\"y\":2493},{\"x\":1537348326000,\"y\":2493}]];\n//\nvar series = [\"timestamp\", \"IMUValues\"];\nvar labels = [\"Labels\"];\nvar data = [];\n\nvar i, len; //string; string = \"\";\n\nfor (i = 1, len = msg.payload.length;  i < len; i++) {\n\n    var thetime = Date.parse(msg.payload[i].timestamp);\n    var thevalue = Number(msg.payload[i].IMUValue);\n\n    data.push({x: thetime, y: thevalue});\n\n    //data.push({ \"x\": Date.parse(msg.payload[i].timestamp) + 2 * 60 * 60, \"y\": Number(msg.payload[i].IMUValue) / 100 });\n}\n\ndata = [data];\n\nmsg.payload = [{ series, data, labels }];\nreturn msg;",
        "outputs": 1,
        "noerr": 0,
        "initialize": "",
        "finalize": "",
        "libs": [],
        "x": 600,
        "y": 540,
        "wires": [
            [
                "e13660ec95d6c4f1"
            ]
        ]
    },
    {
        "id": "e13660ec95d6c4f1",
        "type": "ui_chart",
        "z": "4e100d14e53b3afc",
        "name": "",
        "group": "54831fc8fbeb93e3",
        "order": 0,
        "width": "6",
        "height": "16",
        "label": "Acceleration Values",
        "chartType": "line",
        "legend": "false",
        "xformat": "HH:mm:ss",
        "interpolate": "bezier",
        "nodata": "",
        "dot": true,
        "ymin": "",
        "ymax": "",
        "removeOlder": 1,
        "removeOlderPoints": "",
        "removeOlderUnit": "3600",
        "cutout": 0,
        "useOneColor": false,
        "useUTC": false,
        "colors": [
            "#1f77b4",
            "#aec7e8",
            "#f77502",
            "#2ca02c",
            "#98df8a",
            "#d62728",
            "#ff9896",
            "#9467bd",
            "#c5b0d5"
        ],
        "outputs": 1,
        "useDifferentColor": false,
        "className": "",
        "x": 830,
        "y": 540,
        "wires": [
            []
        ]
    },
    {
        "id": "8c2ee81a9259c669",
        "type": "MSSQL",
        "z": "4e100d14e53b3afc",
        "mssqlCN": "5558b0cd5f739949",
        "name": "",
        "outField": "payload",
        "returnType": 0,
        "throwErrors": 1,
        "query": "SELECT timestamp, IMUValue \r\nFROM t_test\r\nWHERE meassurementID = 3\r\nORDER BY timestamp \r\n  ",
        "modeOpt": "queryMode",
        "modeOptType": "query",
        "queryOpt": "payload",
        "queryOptType": "editor",
        "paramsOpt": "",
        "paramsOptType": "editor",
        "rows": "rows",
        "rowsType": "msg",
        "params": [
            {
                "output": false,
                "name": "ID",
                "type": "int",
                "valueType": "msg",
                "value": "ID",
                "options": {
                    "nullable": true,
                    "primary": false,
                    "identity": false,
                    "readOnly": false
                }
            }
        ],
        "x": 340,
        "y": 540,
        "wires": [
            [
                "a4e8711562181b92"
            ]
        ]
    },
    {
        "id": "54831fc8fbeb93e3",
        "type": "ui_group",
        "name": "Standard",
        "tab": "48c6c05b20fdbbaf",
        "order": 1,
        "disp": true,
        "width": "6",
        "collapse": false,
        "className": ""
    },
    {
        "id": "5558b0cd5f739949",
        "type": "MSSQL-CN",
        "tdsVersion": "7_4",
        "name": "",
        "server": "localhost",
        "port": "1433",
        "encyption": true,
        "trustServerCertificate": true,
        "database": "Node_Red_TestDB",
        "useUTC": true,
        "connectTimeout": "15000",
        "requestTimeout": "15000",
        "cancelTimeout": "5000",
        "pool": "5",
        "parseJSON": false,
        "enableArithAbort": true
    },
    {
        "id": "48c6c05b20fdbbaf",
        "type": "ui_tab",
        "name": "Home",
        "icon": "home",
        "disabled": false,
        "hidden": false
    }
]
The query actually pics the readings with a certain ID
SELECT timestamp, IMUValue
FROM t_test
WHERE meassurementID = 3
ORDER BY timestamp
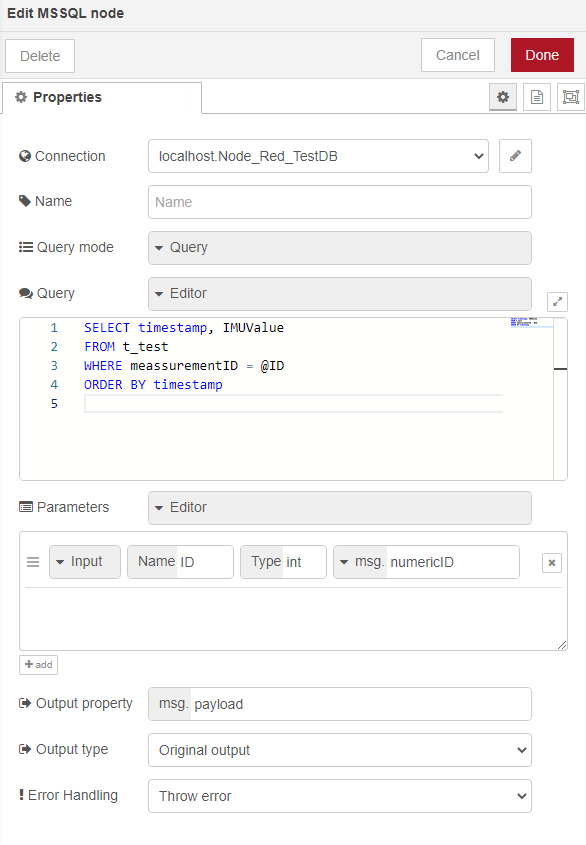
What I am now trying to do is to make the chart changing dynamically acording to a numeric control:


My approach is to hand over the ID to the mssql node but I dont get any values then, the chart is staying empty.
Debug 7 outout:
{"payload":[],"socketid":"jnCGJBUvAZZ2HWCWAAAR","_msgid":"c5b10456bf18d77b","query":"SELECT timestamp, IMUValue \r\nFROM t_test\r\nWHERE meassurementID = @ID\r\nORDER BY timestamp \r\n ","queryMode":"query","queryParams":[{"output":false,"name":"ID","type":{},"options":{"nullable":true,"primary":false,"identity":false,"readOnly":false}}],"sqlInfo":[]}