Hi all,
im trying to build a multi channel servo controller ill be using a PI 3B + with the i2c servo board ( 16 channels per board), what i would like to do is:
- Set a time period
- Realtime record servo positions ( analog controllers!) record to influxdb
- edit a graph to adjust the position of individual servos
- save then playback
its the graph thing im struggling on how to deal with. is the a node that might exist?
I used to do this with midi years ago and used some audio software to adjust the midi values.
Basically an animatronics copycat system.
any suggestions ( polite ones please!)
thanks
This answer seems to have a workable solution that you may be able to adapt:
Running the code snippet lets you drag chart points .
But a quick search showed that several of the chart libraries have drag events that you can tie into.
Something like this? Only as an inspiration.

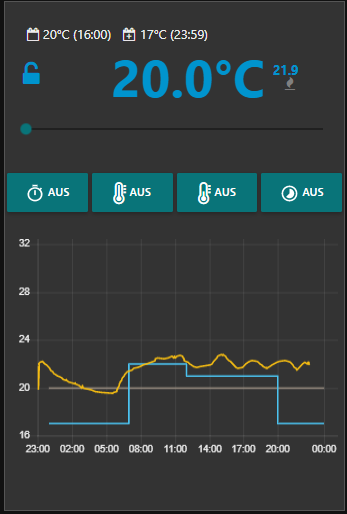
I did years ago with the chart node to setup my room thermostats. The flow is old and filled with a ton of legacy code from my early Node-RED years. Certainly not a task Node-Red is good for. If I would do it again I still would use the dashboard but with one custom ui node.
you can setup rooms and periods
Every room has a phone friendly group with the actual temperature curve superimposed
To be honest ... I don't use it anymore. Settings are so good that it works in the background for years now. So a custom node is not on my agenda.
Thank you for sharing.
Makes me again think about building something similar as a widget - but no. If I don't really need it I should not invest time in it.
Must be honest that I see potential in the proposal from @vikingsraven, because there are a lot of use cases.
Would be nice if somebody could implement a UI widget for this. I'm too busy with other nodes at the moment. The link from @TotallyInformation is a great starting point, but of course extra features would be nice: e.g. have a selection rectangle to (re)move multiple datapoints simultaneously, and so on...
The chartjs-plugin-dragdatajs (mentioned in that Stackoverflow discussion), seems also to be pretty nice...
Thanks for the info all.
Ill have a play and see what it does, not to great with javascript so it will be a good thing to look at .
thanks again
Every time you are stuck, don't hesitate to ask your question here. We will assist you. Always nice to see folks that are interested to start building something like this...
Good luck!
Bart