Filtering of the same messages

Hi,

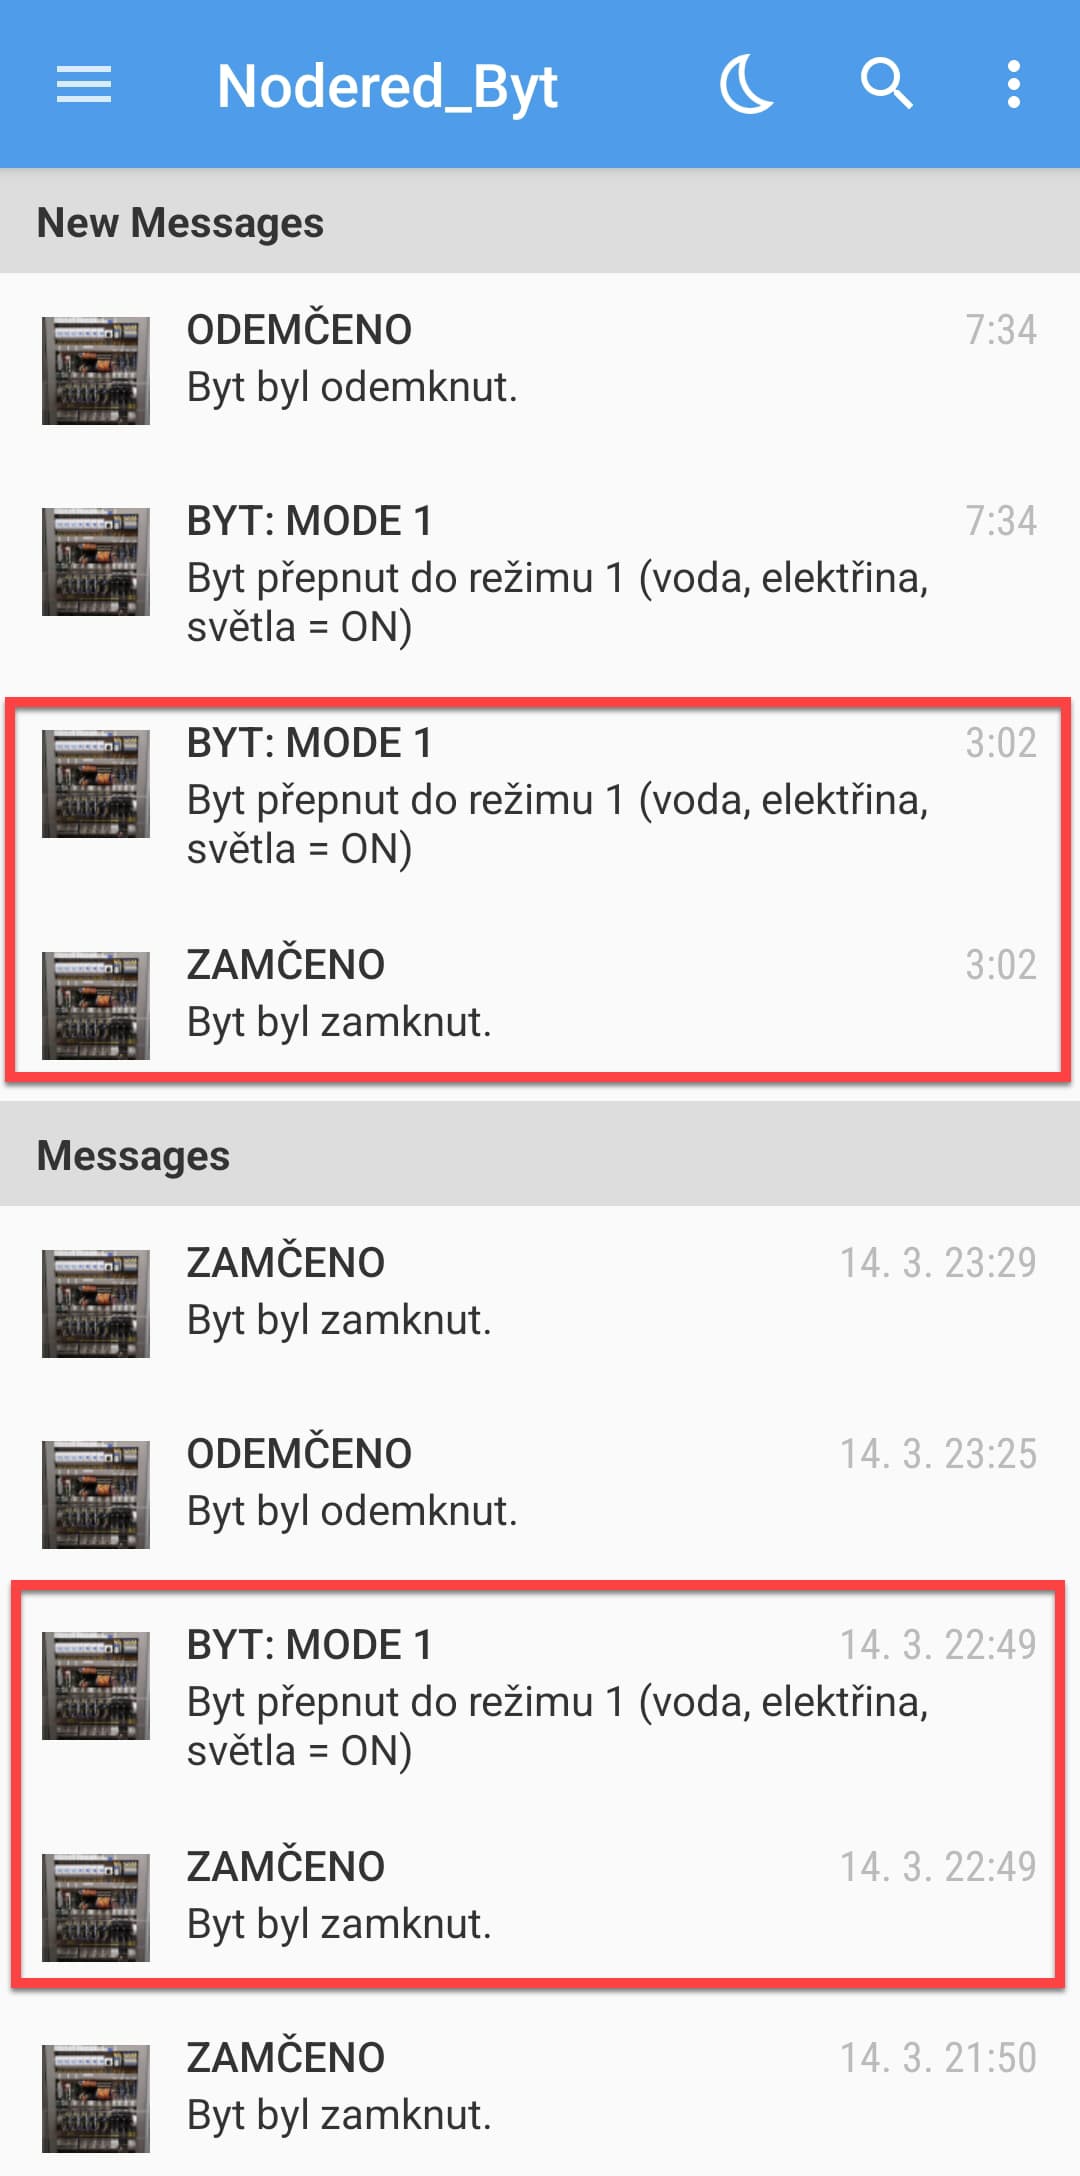
I use Nodered as a graphic interface for PLC. Communication between the PLC and Nodered is via EtherNet/IP (cyclic reading of information every 500ms). I have two variables BOOL and INTEGER. I send their status to the Pushover using Nodered. This state is unchanged for 12 hours, but I receive the information 3 times in that time. For filtering I use the RBE function.

What more can I do to prevent new messages from being sent without changing the state of the variable? Thank you for your help.

Code:

[
    {
        "id": "5d083a808ecd934c",
        "type": "comment",
        "z": "efb7d2d2b6e3c987",
        "name": "PRIORITA: NORMAL________________________________________Info o zamčení/odemčení bytu________________________________________",
        "info": "",
        "x": 653,
        "y": 782,
        "wires": []
    },
    {
        "id": "ad8f434bdc771f7d",
        "type": "comment",
        "z": "efb7d2d2b6e3c987",
        "name": "PRIORITA: NORMAL________________________________________Info o vypnutí/zapnutí bytu________________________________________",
        "info": "",
        "x": 643,
        "y": 918,
        "wires": []
    },
    {
        "id": "922de915ad452dcf",
        "type": "link in",
        "z": "efb7d2d2b6e3c987",
        "name": "",
        "links": [
            "772014ef.1db5cc"
        ],
        "x": 168,
        "y": 1020,
        "wires": [
            [
                "f90fef14f58eb873"
            ]
        ]
    },
    {
        "id": "f90fef14f58eb873",
        "type": "rbe",
        "z": "efb7d2d2b6e3c987",
        "name": "",
        "func": "rbe",
        "gap": "0",
        "start": "",
        "inout": "out",
        "septopics": true,
        "property": "payload",
        "topi": "topic",
        "x": 288,
        "y": 1020,
        "wires": [
            [
                "0e13eb57dd0ddae3"
            ]
        ]
    },
    {
        "id": "07a1e75174b0b799",
        "type": "link in",
        "z": "efb7d2d2b6e3c987",
        "name": "",
        "links": [
            "edede8e9.684b88"
        ],
        "x": 168,
        "y": 850,
        "wires": [
            [
                "6368f49550aeafe3",
                "155fc72718b51181"
            ]
        ]
    },
    {
        "id": "33af2ed61102b39a",
        "type": "switch",
        "z": "efb7d2d2b6e3c987",
        "name": "TRUE/FALSE",
        "property": "payload",
        "propertyType": "msg",
        "rules": [
            {
                "t": "eq",
                "v": "true",
                "vt": "jsonata"
            },
            {
                "t": "eq",
                "v": "false",
                "vt": "jsonata"
            }
        ],
        "checkall": "true",
        "repair": false,
        "outputs": 2,
        "x": 675,
        "y": 850,
        "wires": [
            [
                "87ac6df4ac3c48ef"
            ],
            [
                "27e317e17074b1ca"
            ]
        ]
    },
    {
        "id": "0e13eb57dd0ddae3",
        "type": "switch",
        "z": "efb7d2d2b6e3c987",
        "name": "Režim bytu",
        "property": "payload",
        "propertyType": "msg",
        "rules": [
            {
                "t": "eq",
                "v": "1",
                "vt": "num"
            },
            {
                "t": "eq",
                "v": "2",
                "vt": "num"
            },
            {
                "t": "eq",
                "v": "3",
                "vt": "num"
            },
            {
                "t": "eq",
                "v": "4",
                "vt": "num"
            }
        ],
        "checkall": "true",
        "repair": false,
        "outputs": 4,
        "x": 461,
        "y": 1020,
        "wires": [
            [
                "9c881ba76b909762"
            ],
            [
                "f1015e91e9389cea"
            ],
            [
                "b1161fda29b01e4e"
            ],
            [
                "c043f59197503e53"
            ]
        ]
    },
    {
        "id": "27e317e17074b1ca",
        "type": "function",
        "z": "efb7d2d2b6e3c987",
        "name": "Informace: byt odemknut",
        "func": "msg = {\n    topic : \"ODEMČENO\",\n    payload : \"Byt byl odemknut.\",\n} ;\nreturn msg;",
        "outputs": 1,
        "noerr": 0,
        "initialize": "",
        "finalize": "",
        "libs": [],
        "x": 926,
        "y": 867,
        "wires": [
            [
                "44666a63f396464c"
            ]
        ]
    },
    {
        "id": "44666a63f396464c",
        "type": "pushover",
        "z": "efb7d2d2b6e3c987",
        "name": "Stav zamku",
        "device": "",
        "title": "",
        "priority": "-2",
        "sound": "pushover",
        "url": "",
        "url_title": "",
        "html": true,
        "x": 1226,
        "y": 850,
        "wires": []
    },
    {
        "id": "719c41da0cf82cd3",
        "type": "pushover",
        "z": "efb7d2d2b6e3c987",
        "name": "stav režimu bytu",
        "device": "",
        "title": "",
        "priority": "-2",
        "sound": "mechanical",
        "url": "",
        "url_title": "",
        "html": true,
        "x": 1270,
        "y": 1020,
        "wires": []
    },
    {
        "id": "87ac6df4ac3c48ef",
        "type": "function",
        "z": "efb7d2d2b6e3c987",
        "name": "Informace: byt zamknut",
        "func": "msg = {\n    topic : \"ZAMČENO\",\n    payload : \"Byt byl zamknut.\",\n} ;\nreturn msg;",
        "outputs": 1,
        "noerr": 0,
        "initialize": "",
        "finalize": "",
        "libs": [],
        "x": 926,
        "y": 833,
        "wires": [
            [
                "44666a63f396464c"
            ]
        ]
    },
    {
        "id": "9c881ba76b909762",
        "type": "function",
        "z": "efb7d2d2b6e3c987",
        "name": "Informace: byt v režimu 1 (voda, elektřina, světla = ON)",
        "func": "msg = {\n    topic : \"BYT: MODE 1\",\n    payload : \"Byt přepnut do režimu 1 (voda, elektřina, světla = ON)\",\n} ;\nreturn msg;",
        "outputs": 1,
        "noerr": 0,
        "initialize": "",
        "finalize": "",
        "libs": [],
        "x": 812,
        "y": 969,
        "wires": [
            [
                "719c41da0cf82cd3"
            ]
        ]
    },
    {
        "id": "f1015e91e9389cea",
        "type": "function",
        "z": "efb7d2d2b6e3c987",
        "name": "Informace: byt v režimu 2 (voda a elektřina = ON, světla = OFF)",
        "func": "msg = {\n    topic : \"BYT: MODE 2\",\n    payload : \"Byt přepnut do režimu 2 (voda a elektřina = ON, světla = OFF)\",\n} ;\nreturn msg;",
        "outputs": 1,
        "noerr": 0,
        "initialize": "",
        "finalize": "",
        "libs": [],
        "x": 842,
        "y": 1003,
        "wires": [
            [
                "719c41da0cf82cd3"
            ]
        ]
    },
    {
        "id": "b1161fda29b01e4e",
        "type": "function",
        "z": "efb7d2d2b6e3c987",
        "name": "Informace: byt v režimu 3 (světla = ON, voda a elektřina = OFF)",
        "func": "msg = {\n    topic : \"BYT: MODE 3\",\n    payload : \"Byt přepnut do režimu 3 (světla = ON, voda a elektřina = OFF)\",\n} ;\nreturn msg;",
        "outputs": 1,
        "noerr": 0,
        "initialize": "",
        "finalize": "",
        "libs": [],
        "x": 842,
        "y": 1037,
        "wires": [
            [
                "719c41da0cf82cd3"
            ]
        ]
    },
    {
        "id": "c043f59197503e53",
        "type": "function",
        "z": "efb7d2d2b6e3c987",
        "name": "Informace: byt v režimu 4 (voda,elektřina,světla = OFF)",
        "func": "msg = {\n    topic : \"BYT: MODE 4\",\n    payload : \"Byt přepnut do režimu 4 (voda, elektřina, světla = OFF)\",\n} ;\nreturn msg;",
        "outputs": 1,
        "noerr": 0,
        "initialize": "",
        "finalize": "",
        "libs": [],
        "x": 812,
        "y": 1071,
        "wires": [
            [
                "719c41da0cf82cd3"
            ]
        ]
    },
    {
        "id": "6368f49550aeafe3",
        "type": "debug",
        "z": "efb7d2d2b6e3c987",
        "name": "",
        "active": false,
        "tosidebar": true,
        "console": false,
        "tostatus": false,
        "complete": "false",
        "statusVal": "",
        "statusType": "auto",
        "x": 343,
        "y": 816,
        "wires": []
    },
    {
        "id": "155fc72718b51181",
        "type": "rbe",
        "z": "efb7d2d2b6e3c987",
        "name": "",
        "func": "rbe",
        "gap": "0",
        "start": "",
        "inout": "out",
        "septopics": true,
        "property": "payload",
        "topi": "topic",
        "x": 322,
        "y": 850,
        "wires": [
            [
                "33af2ed61102b39a"
            ]
        ]
    }
]

Are you 100% certain the value did not change in the PLC? You might have a bug in the ladder or intermittent input (noise/induction/bad contact etc). To help discover that I would normally add a counter (in the ladder) & see how many times the input/value changes. If you don't do this and simply mask the problem, you might end up with a worse situation.

If you absolutely can't do that (or find there is no issue in the PLC), you could debounce the value. Add a trigger node before the RBE. set it to send nothing, then wait for 10s (or whatever is necessary), then send the latest message.

Another possibility is that node red is restarting for some reason. If you are running on a Linux based system then have a look in /var/log/syslog at the time it happens and see if there is anything there.
Also make the debug nodes that you add to monitor it, output to the console then you will see them in the log too.

@Steve-Mcl

The first variable is BOOL directly connected from the inductive sensor. In nodered I check both states and send both states to pushover. In the pushover, however, I only get one state repeated.

The second variable is the current technology mode, I count the change of this mode with a counter. There is a change about 3 times a day, but in pushover I have the information sent about 15 times.

@Colin

I have Nodered on RPI4. I didn't find any information about reboot in the Syslog file at the given times.

Mar 14 22:43:31 nodered systemd[1]: apt-daily.service: Consumed 2.991s CPU time.
Mar 14 22:45:56 nodered systemd[1]: Stopping Network Time Synchronization...
Mar 14 22:45:56 nodered systemd[1]: systemd-timesyncd.service: Succeeded.
Mar 14 22:45:56 nodered systemd[1]: Stopped Network Time Synchronization.
Mar 14 22:45:56 nodered systemd[1]: Starting Network Time Synchronization...
Mar 14 22:45:56 nodered systemd[1]: Started Network Time Synchronization.
Mar 14 22:45:56 nodered systemd-timesyncd[22832]: Initial synchronization to time server 162.159.200.123:123 (0.debian.pool.ntp.org).
Mar 14 22:50:56 nodered systemd[1]: Stopping Network Time Synchronization...
Mar 14 22:50:56 nodered systemd[1]: systemd-timesyncd.service: Succeeded.
Mar 14 22:50:56 nodered systemd[1]: Stopped Network Time Synchronization.
Mar 14 22:50:56 nodered systemd[1]: Starting Network Time Synchronization...
Mar 14 22:50:56 nodered systemd[1]: Started Network Time Synchronization.
Mar 14 22:50:56 nodered systemd-timesyncd[22853]: Initial synchronization to time server 147.251.48.140:123 (0.debian.pool.ntp.org).
Mar 14 22:55:56 nodered systemd[1]: Stopping Network Time Synchronization...
Mar 14 22:55:56 nodered systemd[1]: systemd-timesyncd.service: Succeeded.
Mar 14 22:55:56 nodered systemd[1]: Stopped Network Time Synchronization.
Mar 14 22:55:56 nodered systemd[1]: Starting Network Time Synchronization...
Mar 14 22:55:56 nodered systemd[1]: Started Network Time Synchronization.
Mar 14 22:55:56 nodered systemd-timesyncd[22875]: Initial synchronization to time server 162.159.200.1:123 (0.debian.pool.ntp.org).
Mar 14 23:00:56 nodered systemd[1]: Stopping Network Time Synchronization...
Mar 15 02:55:57 nodered systemd-timesyncd[23989]: Initial synchronization to time server 213.192.54.227:123 (0.debian.pool.ntp.org).
Mar 15 03:00:57 nodered systemd[1]: Stopping Network Time Synchronization...
Mar 15 03:00:57 nodered systemd[1]: systemd-timesyncd.service: Succeeded.
Mar 15 03:00:57 nodered systemd[1]: Stopped Network Time Synchronization.
Mar 15 03:00:57 nodered systemd[1]: Starting Network Time Synchronization...
Mar 15 03:00:57 nodered systemd[1]: Started Network Time Synchronization.
Mar 15 03:00:57 nodered systemd-timesyncd[24011]: Initial synchronization to time server 194.182.80.233:123 (0.debian.pool.ntp.org).
Mar 15 03:02:30 nodered npm[1615]: #033[32mZigbee2MQTT:info #033[39m 2022-03-15 03:02:30: MQTT publish: topic 'zigbee2mqtt/teplota', payload '{"battery":100,"humidity":20.16,"linkquality":134,"pressure":1002.7,"temperature":21.21,"voltage":3005}'
Mar 15 03:05:57 nodered systemd[1]: Stopping Network Time Synchronization...
Mar 15 03:05:57 nodered systemd[1]: systemd-timesyncd.service: Succeeded.
Mar 15 03:05:57 nodered systemd[1]: Stopped Network Time Synchronization.
Mar 15 03:05:57 nodered systemd[1]: Starting Network Time Synchronization...
Mar 15 03:05:57 nodered systemd[1]: Started Network Time Synchronization.
Mar 15 03:05:57 nodered systemd-timesyncd[24033]: Initial synchronization to time server 213.192.54.227:123 (0.debian.pool.ntp.org).
Mar 15 03:10:01 nodered CRON[24040]: (root) CMD (test -e /run/systemd/system || SERVICE_MODE=1 /sbin/e2scrub_all -A -r)

Interestingly, I use pushover for multiple variables and the others work correctly and don't repeat. :man_shrugging:

Is your log full of those time sync messages? That suggests that something is is going on with your system.

We await the results from your debug nodes outputting to the console which will let you work out where the extra messages are coming from. Make sure to give the debug nodes names to make it easier to interpret the log.

Yes this information about time sync is repeated all the time, but unfortunately I'm not very experienced in linux, so I don't know where to look for the problem.

I have updated the Rasbian and NTP server. I will give it some time and check if it helped.
image

I have prepared the debug node, now I am waiting for some results.

I don't think you have set the debug nodes to output to the console (and hence the log).

If you have a DIY time server then likely it is an issue with that, or how you have told the pi to use it.

I made a mistake at the beginning. :roll_eyes: Now I noticed that I downloaded the SYSLOG from the wrong RPI. in the correct RPI you can really see the restart.

Mar 15 03:02:17 raspberrypi Node-RED[15415]: <--- Last few GCs --->
Mar 15 03:02:17 raspberrypi Node-RED[15415]: [15415:0x51a0bd8] 35048904 ms: Scavenge (reduce) 1700.2 (1812.5) -> 1698.5 (1820.5) MB, 53.8 / 0.0 ms  (average mu = 0.929, current mu = 0.886) allocation failure
Mar 15 03:02:17 raspberrypi Node-RED[15415]: [15415:0x51a0bd8] 35049150 ms: Scavenge (reduce) 1700.4 (1812.5) -> 1699.1 (1820.5) MB, 40.0 / 0.0 ms  (average mu = 0.929, current mu = 0.886) allocation failure
Mar 15 03:02:17 raspberrypi Node-RED[15415]: [15415:0x51a0bd8] 35049305 ms: Scavenge (reduce) 1700.8 (1812.5) -> 1699.3 (1820.5) MB, 30.7 / 0.0 ms  (average mu = 0.929, current mu = 0.886) allocation failure
Mar 15 03:02:17 raspberrypi Node-RED[15415]: <--- JS stacktrace --->
Mar 15 03:02:17 raspberrypi Node-RED[15415]: FATAL ERROR: Committing semi space failed. Allocation failed - JavaScript heap out of memory
Mar 15 03:02:18 raspberrypi systemd[1]: nodered.service: Main process exited, code=killed, status=6/ABRT
Mar 15 03:02:18 raspberrypi systemd[1]: nodered.service: Failed with result 'signal'.
Mar 15 03:02:38 raspberrypi systemd[1]: nodered.service: Service RestartSec=20s expired, scheduling restart.
Mar 15 03:02:38 raspberrypi systemd[1]: nodered.service: Scheduled restart job, restart counter is at 307.
Mar 15 03:02:38 raspberrypi systemd[1]: Stopped Node-RED graphical event wiring tool.
Mar 15 03:02:38 raspberrypi systemd[1]: Started Node-RED graphical event wiring tool.
Mar 15 03:02:39 raspberrypi Node-RED[17651]: 15 Mar 03:02:39 - [info]
Mar 15 03:02:39 raspberrypi Node-RED[17651]: Welcome to Node-RED
Mar 15 03:02:39 raspberrypi Node-RED[17651]: ===================
Mar 15 03:02:39 raspberrypi Node-RED[17651]: 15 Mar 03:02:39 - [info] Node-RED version: v2.1.4
Mar 15 03:02:39 raspberrypi Node-RED[17651]: 15 Mar 03:02:39 - [info] Node.js  version: v14.18.2
Mar 15 03:02:39 raspberrypi Node-RED[17651]: 15 Mar 03:02:39 - [info] Linux 5.10.63-v7l+ arm LE
Mar 15 03:02:40 raspberrypi Node-RED[17651]: 15 Mar 03:02:40 - [info] Loading palette nodes
Mar 15 03:02:41 raspberrypi Node-RED[17651]: BAIL ON node-red-contrib-cron-plus/cronplus
Mar 15 03:02:42 raspberrypi Node-RED[17651]: BAIL ON node-red-contrib-ibm-watson-iot/wiotp
Mar 15 03:02:42 raspberrypi Node-RED[17651]: BAIL ON node-red-contrib-modbustcp/modbus tcp
Mar 15 03:02:43 raspberrypi Node-RED[17651]: BAIL ON node-red-contrib-play-audio/play-audio
Mar 15 03:02:43 raspberrypi Node-RED[17651]: 15 Mar 03:02:43 - [info] Dashboard version 3.1.3 started at /ui
Mar 15 03:02:43 raspberrypi Node-RED[17651]: BAIL ON node-red-node-pi-gpio/rpi-gpio
Mar 15 03:02:43 raspberrypi Node-RED[17651]: BAIL ON node-red-node-ping/ping
Mar 15 03:02:43 raspberrypi Node-RED[17651]: BAIL ON node-red-node-random/random
Mar 15 03:02:44 raspberrypi Node-RED[17651]: BAIL ON node-red-node-serialport/serialport
Mar 15 03:02:44 raspberrypi Node-RED[17651]: BAIL ON node-red-node-smooth/smooth
Mar 15 03:02:44 raspberrypi Node-RED[17651]: BAIL ON node-red-node-tail/tail
Mar 15 03:02:44 raspberrypi Node-RED[17651]: 15 Mar 03:02:44 - [warn] ------------------------------------------------------
Mar 15 03:02:44 raspberrypi Node-RED[17651]: 15 Mar 03:02:44 - [warn] [node-red-node-rbe/rbe] 'rbe' already registered by module node-red
Mar 15 03:02:44 raspberrypi Node-RED[17651]: 15 Mar 03:02:44 - [warn] ------------------------------------------------------
Mar 15 03:02:44 raspberrypi Node-RED[17651]: 15 Mar 03:02:44 - [info] Settings file  : /home/pi/.node-red/settings.js
Mar 15 03:02:44 raspberrypi Node-RED[17651]: 15 Mar 03:02:44 - [info] Context store  : 'default' [module=memory]
Mar 15 03:02:44 raspberrypi Node-RED[17651]: 15 Mar 03:02:44 - [info] User directory : /home/pi/.node-red
Mar 15 03:02:44 raspberrypi Node-RED[17651]: 15 Mar 03:02:44 - [warn] Projects disabled : editorTheme.projects.enabled=false
Mar 15 03:02:44 raspberrypi Node-RED[17651]: 15 Mar 03:02:44 - [warn] Flows file name not set. Generating name using hostname.
Mar 15 03:02:44 raspberrypi Node-RED[17651]: 15 Mar 03:02:44 - [info] Flows file     : /home/pi/.node-red/flows_raspberrypi.json
Mar 15 03:02:44 raspberrypi Node-RED[17651]: 15 Mar 03:02:44 - [info] Server now running at http://127.0.0.1:1880/
Mar 15 03:02:44 raspberrypi Node-RED[17651]: 15 Mar 03:02:44 - [warn]
Mar 15 03:02:44 raspberrypi Node-RED[17651]: ---------------------------------------------------------------------
Mar 15 03:02:44 raspberrypi Node-RED[17651]: Your flow credentials file is encrypted using a system-generated key.
Mar 15 03:02:44 raspberrypi Node-RED[17651]: If the system-generated key is lost for any reason, your credentials
Mar 15 03:02:44 raspberrypi Node-RED[17651]: file will not be recoverable, you will have to delete it and re-enter
Mar 15 03:02:44 raspberrypi Node-RED[17651]: your credentials.
Mar 15 03:02:44 raspberrypi Node-RED[17651]: You should set your own key using the 'credentialSecret' option in
Mar 15 03:02:44 raspberrypi Node-RED[17651]: your settings file. Node-RED will then re-encrypt your credentials
Mar 15 03:02:44 raspberrypi Node-RED[17651]: file using your chosen key the next time you deploy a change.
Mar 15 03:02:44 raspberrypi Node-RED[17651]: ---------------------------------------------------------------------
Mar 15 03:02:45 raspberrypi Node-RED[17651]: 15 Mar 03:02:45 - [info] Starting flows
Mar 15 03:02:45 raspberrypi Node-RED[17651]: 15 Mar 03:02:45 - [info] Started flows
Mar 15 03:02:46 raspberrypi Node-RED[17651]: 15 Mar 03:02:46 - [info] [mqtt-broker:Byt] Connected to broker: mqtt://localhost:1883

EDIT: If I understand correctly, I have a problem with a lack of operating memory.

Blockquote
If you have a DIY time server then likely it is an issue with that, or how you have told the pi to use it.

I'm using the official time server.

The problem is more likely that something is using up all the memory.

In a terminal run
top
and show us what you see.

Something is clogging up node red, it is hogging a complete core (%CPU 99%) and is using 40% of the available MEM. Probably that will increase if you watch it for a while.
Probably you have something stuck in a loop somewhere.

So the load of CPU is created by Ethernet/IP communication with the PLC. Unfortunately this is an essential element without communication is nodered useless to me. I have reduced the read cycle on communication from 250ms to 1000ms and am currently at 75%.

I doubt whether it is the communications that is loading the processor. Most likely it is what you then do with the results. Possibly, at the previous rate, you were fetching data faster than you could handle it and messages were queueing up and eventually using up all the memory, hence the crash. You must be doing something pretty intensive to use a full core of a pi4, especially if you are only running it 4 times a second. If it were 1000 times a second it would be more reasonable.
What are you doing with the data?

I've moved on again. The communication itself loads the processor to about 10%, but the subsequent data processing to the resulting 100%.

What can I do in nodered to optimize this? I split the received message between approximately 100 individual links, which I send to the next flow.

flows.json (276.9 KB)

I use most of the data to display in the dashboard. Some of it is used to send email notifications and pushover.

I use the dashboard as a HMI for smart home, so the 1s response delay is sometimes already quite noticeable. :roll_eyes:

EDIT: I will try to divide the data into several groups and manage their processing accordingly.

Each of those function nodes could just be a Change node. However, there is usually no need to do that. In a most dashboard nodes you can select which property to show so there is no need to do it there. You can feed the full structure into all the dashboard nodes and, for example, if it is a text or gauge node, you can put something like {{msg.payload.EIP_OUT_Byt_light}}, as described in the help text for those nodes. It is only, I think, for Chart nodes that you need to have the value in the payload.

That will also get rid of all those debug nodes which can also add a significant overhead I think.

Wow. So that means every 0.5s you receive (quite a lot) of data in a msg
It is then branched off to 100+ wires (thats 100+ clones of the incoming data every 0.5s)

then after EVERY function node, you have 2 wires (thats another cloned msg)

This is a lot of msgs floating around. That will definitely eat up the heap & CPU cycles.


As colin said, delete as many of those wires, function and debugs and links as you can & where possible, simply use the property name.

EG in a text node

image

And if you DO need to move/copy a value to msg.payload then use a change node
image

I tried to use all the advice and the result is 50-60% CPU load. When I compare it to 100% load, it's not bad :). A lot of splits could not be cancelled due to further processing (unit conversion and so on) or use in NODEs that don't support it (AND, OR, Dashboard button, ...)

Thank you very much for your help with diagnosis and problem solving!

Could you reduce some of your splits by doing multiple conversions etc in the same function node, adding to the payload and passing on to the flow ?

I'm not sure what you are monitoring but as you mentioned smart home, can you not reduce the message rate some more ? I thought I was bad having some sensors at 30s update :wink: