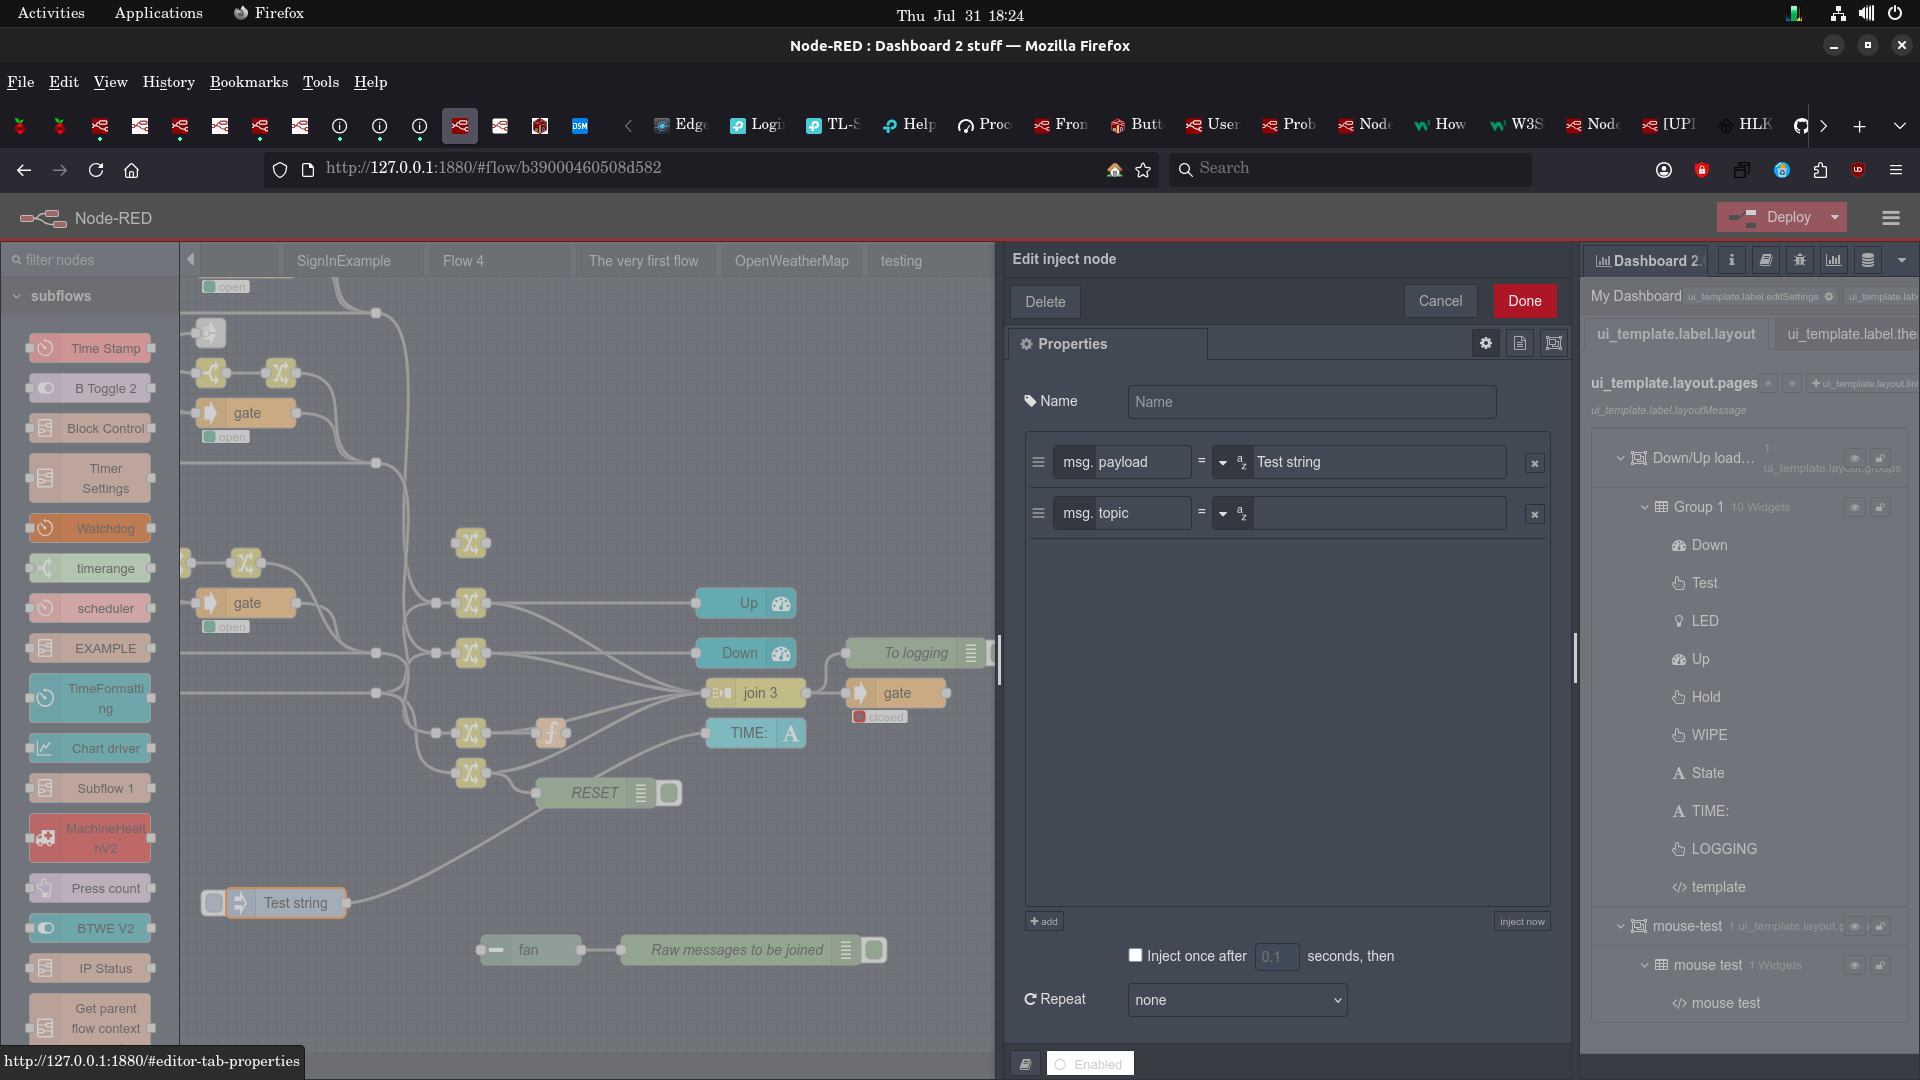
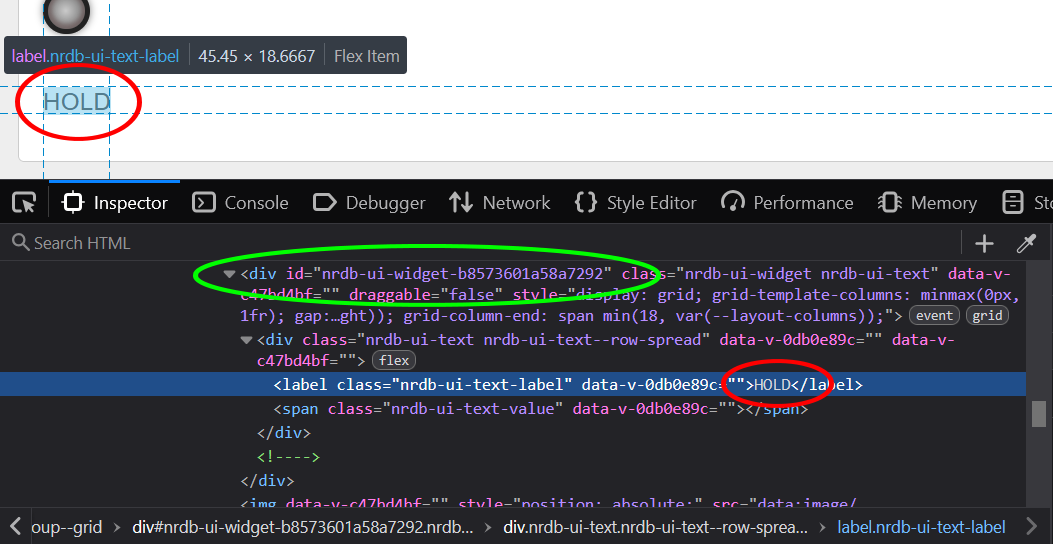
This is a bit of code around the HOLD button:
[{"id":"b5464c8f75a40b48","type":"switch","z":"b39000460508d582","name":"","property":"payload","propertyType":"msg","rules":[{"t":"eq","v":"1","vt":"num"},{"t":"eq","v":"0","vt":"num"}],"checkall":"true","repair":false,"outputs":2,"x":245,"y":500,"wires":[["5513ad5fecf8055c"],["7435390d94ef877d"]],"l":false},{"id":"e219198a37ba75b2","type":"change","z":"b39000460508d582","name":"Default","rules":[{"t":"set","p":"ui_update.buttonColor","pt":"msg","to":"blue","tot":"str"},{"t":"set","p":"ui_update.label","pt":"msg","to":"PASS","tot":"str"}],"action":"","property":"","from":"","to":"","reg":false,"x":350,"y":450,"wires":[["de5be44bacf7ef7d"]]},{"id":"4dacdab6124ba2a9","type":"inject","z":"b39000460508d582","name":"","props":[{"p":"payload"},{"p":"topic","vt":"str"}],"repeat":"","crontab":"","once":true,"onceDelay":"2","topic":"","payload":"","payloadType":"date","x":245,"y":450,"wires":[["e219198a37ba75b2"]],"l":false},{"id":"5513ad5fecf8055c","type":"change","z":"b39000460508d582","name":"Normal","rules":[{"t":"set","p":"ui_update.label","pt":"msg","to":"PASS","tot":"str"},{"t":"set","p":"ui_update.buttonColor","pt":"msg","to":"green","tot":"str"},{"t":"delete","p":"payload","pt":"msg"}],"action":"","property":"","from":"","to":"","reg":false,"x":350,"y":490,"wires":[["de5be44bacf7ef7d"]]},{"id":"7435390d94ef877d","type":"change","z":"b39000460508d582","name":"Hold","rules":[{"t":"set","p":"ui_update.label","pt":"msg","to":"HOLD","tot":"str"},{"t":"set","p":"ui_update.buttonColor","pt":"msg","to":"red","tot":"str"},{"t":"delete","p":"payload","pt":"msg"}],"action":"","property":"","from":"","to":"","reg":false,"x":340,"y":530,"wires":[["de5be44bacf7ef7d"]]},{"id":"de5be44bacf7ef7d","type":"ui-button","z":"b39000460508d582","group":"6f4a6f88bfbb219b","name":"Hold","label":"","order":5,"width":"1","height":"1","emulateClick":false,"tooltip":"","color":"","bgcolor":"","className":"","icon":"","iconPosition":"left","payload":"X","payloadType":"str","topic":"topic","topicType":"msg","buttonColor":"","textColor":"","iconColor":"","enableClick":true,"enablePointerdown":false,"pointerdownPayload":"","pointerdownPayloadType":"str","enablePointerup":false,"pointerupPayload":"","pointerupPayloadType":"str","x":520,"y":490,"wires":[["5bdde14fb80b87f6","b5d74453ad226bca"]]},{"id":"6f4a6f88bfbb219b","type":"ui-group","name":"Group 1","page":"b9b507aa5c5840c2","width":"10","height":1,"order":1,"showTitle":false,"className":"","visible":true,"disabled":"false","groupType":"default"},{"id":"b9b507aa5c5840c2","type":"ui-page","name":"Down/Up load speed tester","ui":"379027033ed5c83a","path":"/page1","icon":"home","layout":"flex","theme":"84a68e3f4c6f8cdc","breakpoints":[{"name":"Default","px":"0","cols":"3"},{"name":"Tablet","px":"576","cols":"6"},{"name":"Small Desktop","px":"768","cols":"9"},{"name":"Desktop","px":"1024","cols":"12"}],"order":1,"className":"","visible":true,"disabled":false},{"id":"379027033ed5c83a","type":"ui-base","name":"My Dashboard","path":"/dashboard","appIcon":"","includeClientData":true,"acceptsClientConfig":["ui-notification","ui-control"],"showPathInSidebar":false,"headerContent":"page","navigationStyle":"default","titleBarStyle":"default","showReconnectNotification":true,"notificationDisplayTime":1,"showDisconnectNotification":true,"allowInstall":true},{"id":"84a68e3f4c6f8cdc","type":"ui-theme","name":"Default Theme","colors":{"surface":"#63452c","primary":"#0094ce","bgPage":"#63452c","groupBg":"#63452c","groupOutline":"#cccccc"},"sizes":{"density":"default","pagePadding":"12px","groupGap":"12px","groupBorderRadius":"4px","widgetGap":"12px"}}]
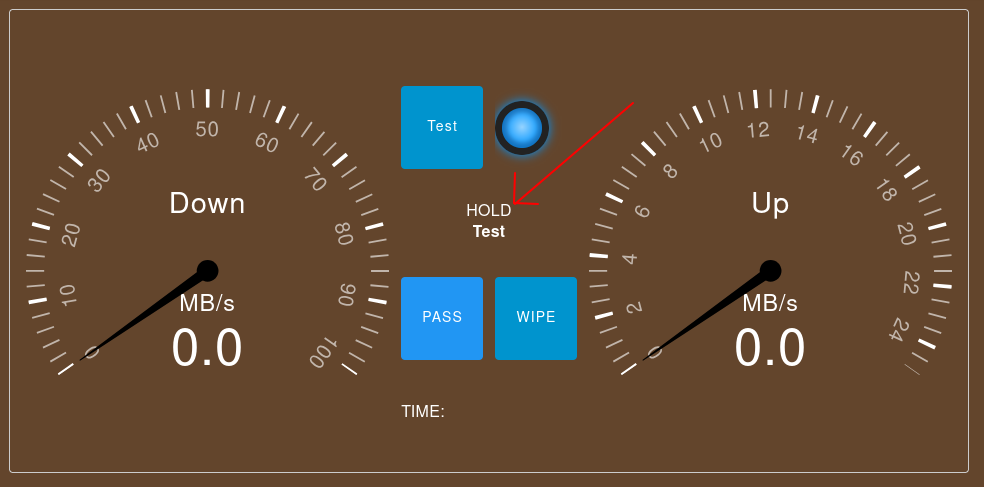
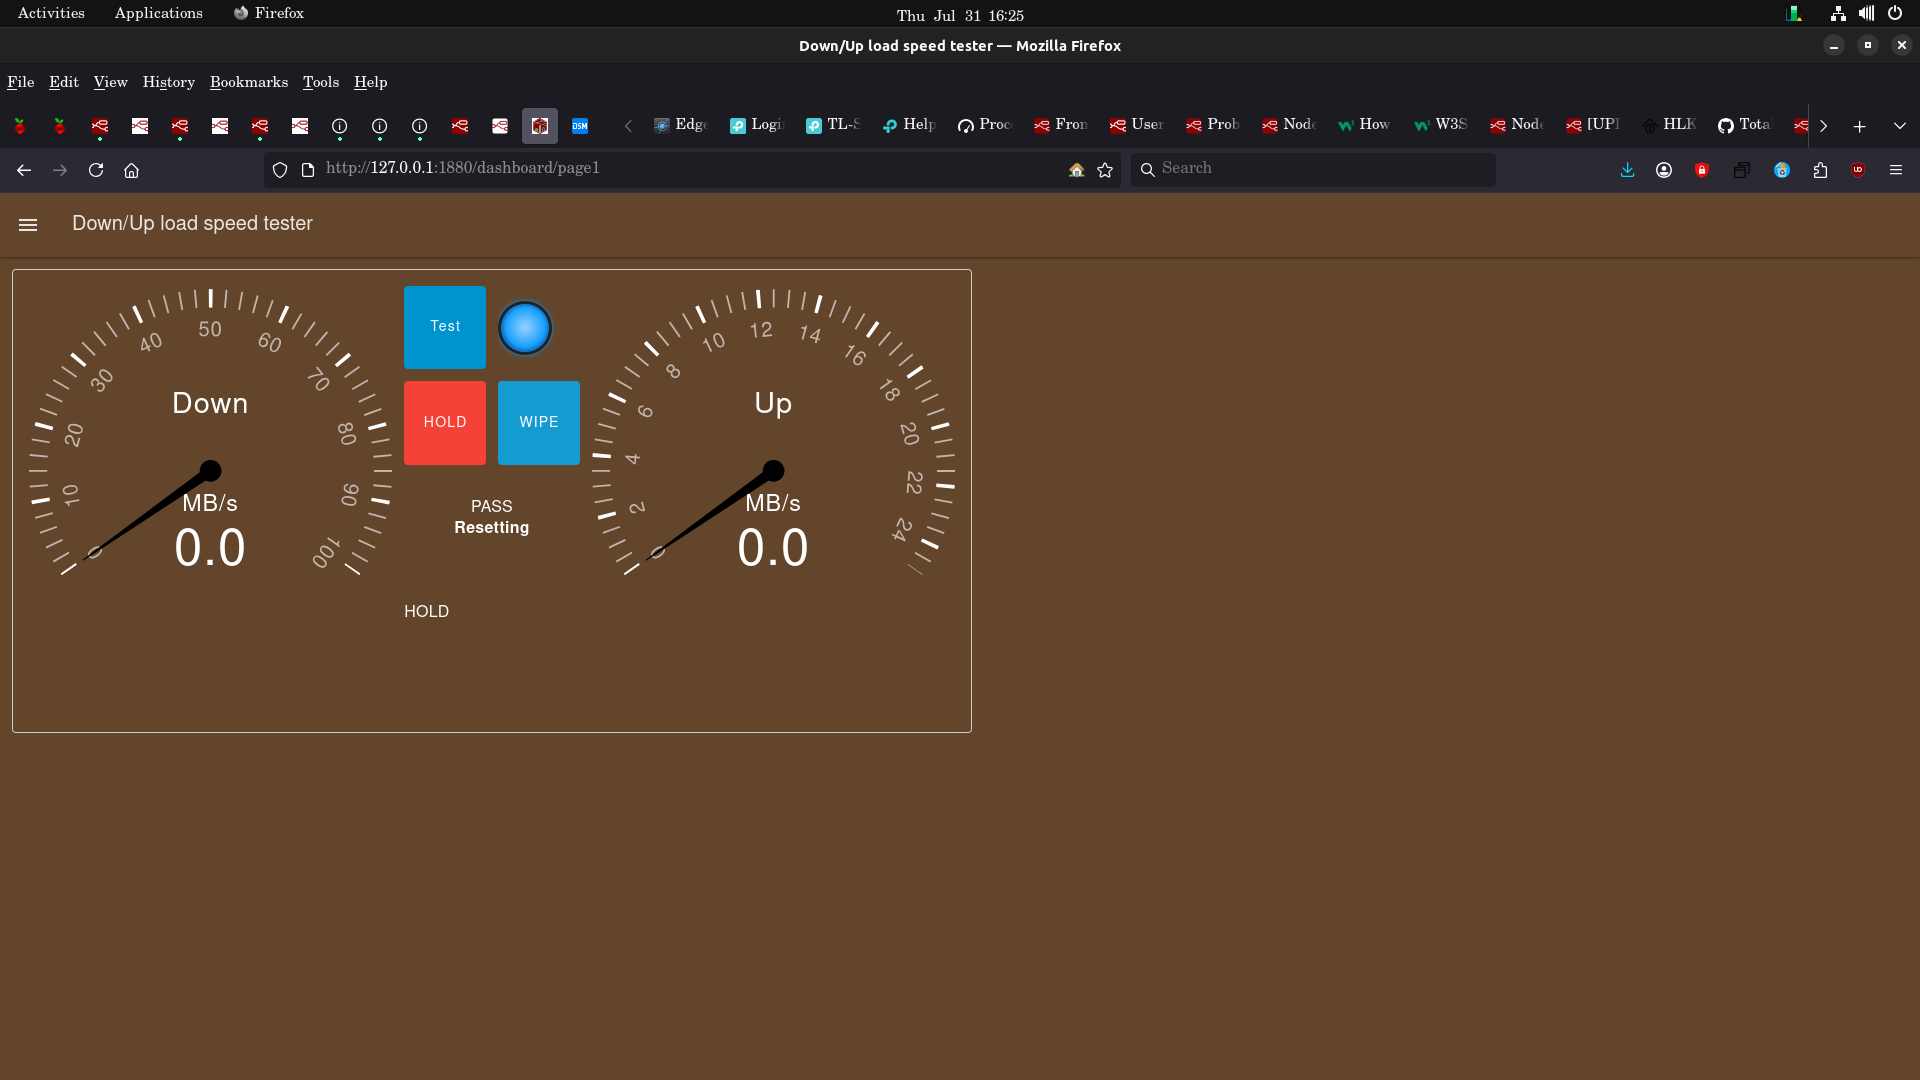
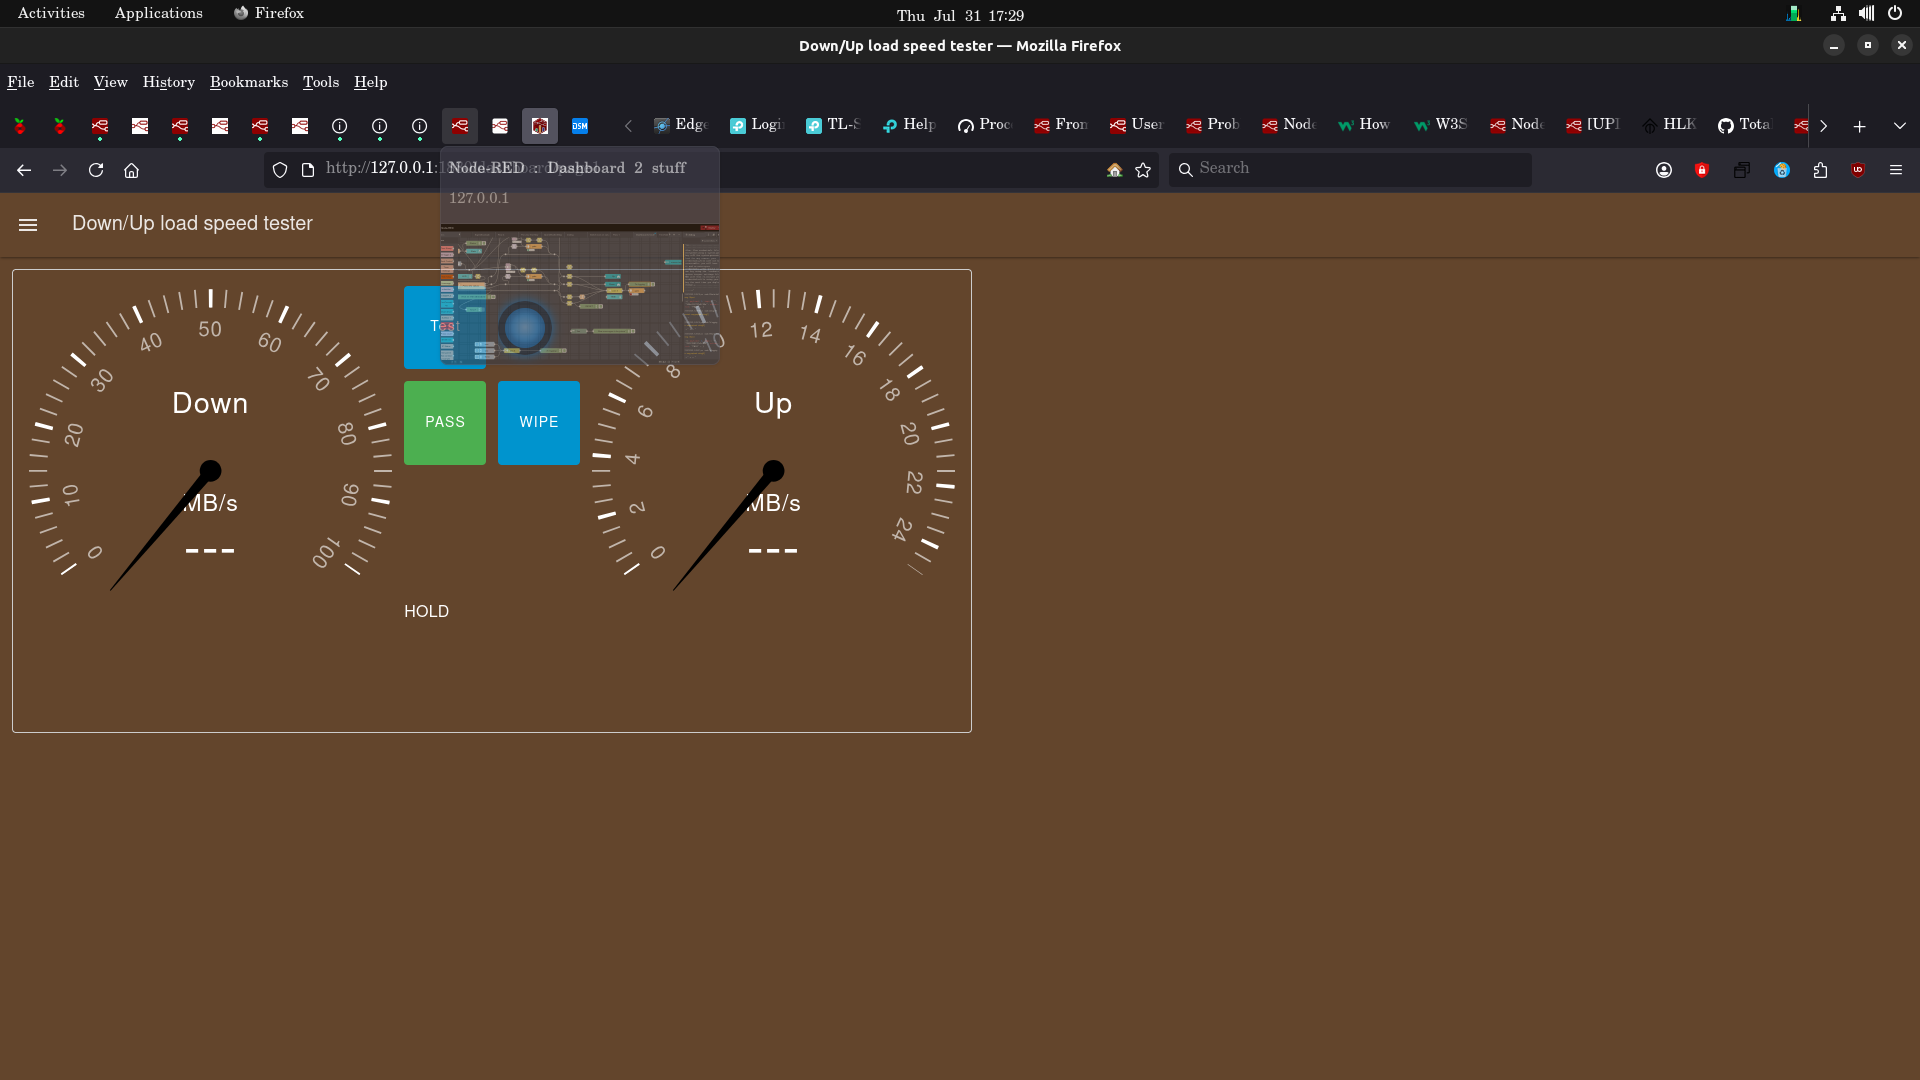
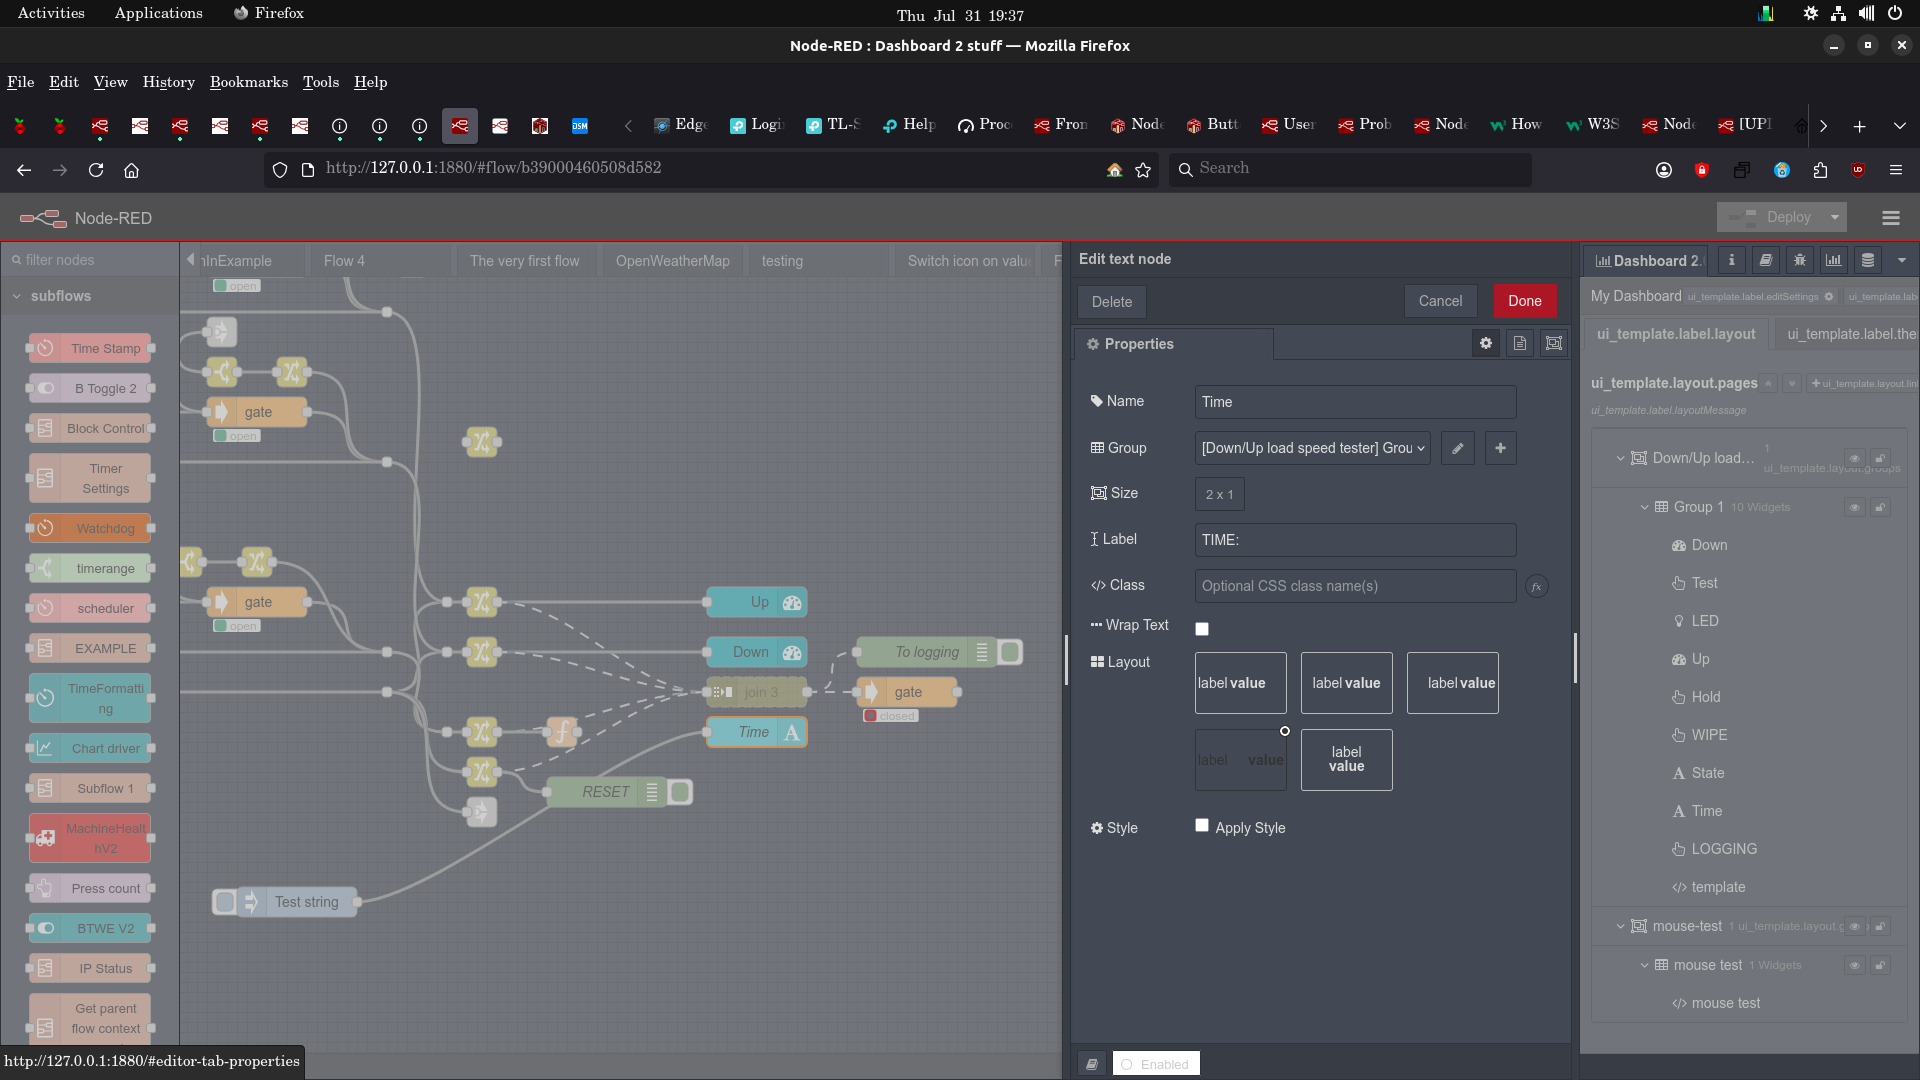
Also a screen shot: