Hardware recommendations (2022) for node red home automation server

hi everyone,
I understand that this topic had been approached a couple of times in the past and there is no one-size -fits-all but I wanted to reach out to the community for their practical experience and tips on what my "next hardware platform" should be.

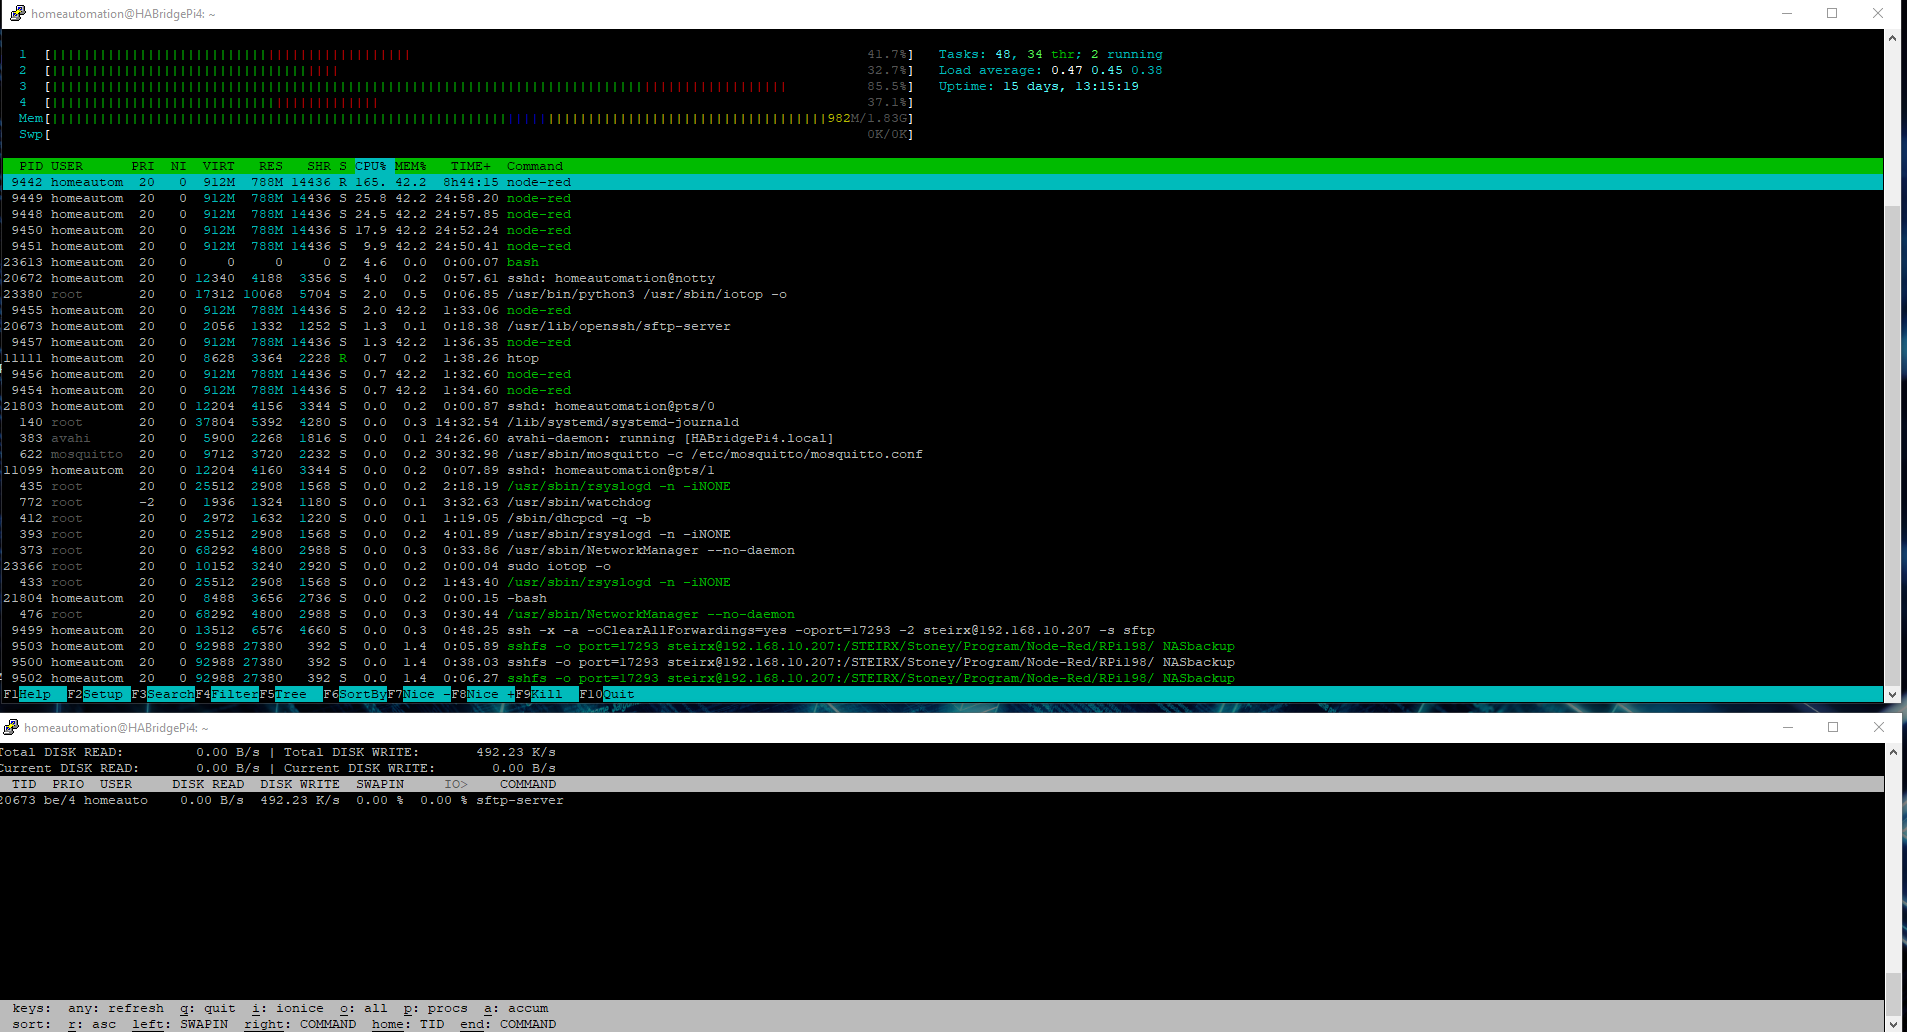
I am sure I am NOT the most resource-saving programmer but I seem to get to the limits of my Raspberry Pi 4B (with SSD) on what it can handle (and I am not finished playing around / expanding our home automation setup yet!).

At present I am running:
totalNodesCount: 7840
tabsCount: 69
subflowsCount: 19
nodeTypesCount: 150

There are a fair number of short term trend charts with 24h history, which I am sure have a biggish impact on resource requirements (long term trending is still done on my homematic historian but also with the aim to move this back to an e.g. grafana / influxdb setup on that same device). I have overclocked to 2GHz recently and I have the impression that my unscheduled node-red restarts have gone up since. Average load is in the range of 10-20% CPU.


Generally, I am really happy with the ease of use of the RPi and community support for all kinds of functions. And a further important point for me is power consumption. I would not entertain the notion of running a desktop pc / laptop hw full time with an "empty" load consumption of over 30W ... however, I have a total of probably 6 or 7 RPis running with various distributed functions and I might consider to consolidate these into that single device / unit to further improve on power consumption plus fewer points of failure (finally entering the docker domain comes to mind ...).

So, reading specs is one thing, YOUR experience and expertise with particular devices NOW available on the market another! And I am not entirely sure where the current bottle neck of my node red setup is! "Uploading" a changed flow takes about 15 seconds, where the first 10 seconds or so "doing nothing" happens). Operation of the dashboard on a fast device is fine and "fluid", my several year old wall mounted tablets (iPad4 and Cube iWork10 i15 running Windows 10) are rather sluggish. My 2 year old Android phone (sony xperia 5) is reasonably responsive, similar to my i7 laptop.

Compared to the RPi 4B, my aim would be to

  • at least doubling processing capabilities (what is important for my head-less node red installation?)
  • similar (or better?) reliability
  • "comparable" power consumption (sub 15W as a guess?)
  • I am not a linux guy but with all the help that is around, setting up and running my RPi was OK. So, the new platform should not be a complete "alien" regarding setup procedures and community support!

Looking forward to you suggestions!

THANKS
Robert

Just one question: Why so many MQTT messages per second on a home automation system?

Valid question @ghayne!
I have chosen mqtt as my home automation communication "backbone". I started of with wifi based tasmota devices of which I have still 21 running and more recently expanded to zigbee based devices (better mesh network capability I liked) of which I now have about 48 or so deployed. These include power measuring units, which report back more frequently than on-off switches. The average idles around 0-2 msg/sec but I do see the peaks in my chart!
I recently was testing a very cheap air quality monitoring station which "flooded" the network with 3 updates per second. Only a short while ago, I limited that on the zigbee2mqtt side to no more than 1 update per 3 seconds and that has taken off a considerable amount of mqtt messages. However, I saw "0 impact" on my RPi 4 CPU average which also host the mqtt server.
So, my gut feeling is, mqtt is not "my problem" for performance (I can't be sure though!).
I think it has to do with some of the "larger" short term trend charts (ui_chart) that have creeped in over time ...
thanks!

How much data are you putting into them and is it really needed? You say you swapped the air quality sendsor from 1/second to 3/second. Do you really need to know the air quality very 3 seconds? Does it change that fast? why not try every 30 seconds or 5 minutes?

3 Likes

hi @zenofmud
No, I don't need to know the air quality every 3 seconds but as I stated, even the flood of 3 msg per second didn't seem to be a real problem for my setup - it was more of an annoyance when I was monitoring / commissioning new zigbee hardware and my status screen was constantly flooded with something irrelevant ... :wink:
Regarding the ui_chart - you know how it is. short term trend curves are kind of nice to see the recent past of a "device / status" on the dashboard (e.g. motion alert / doorbell ring on the front door, ev charging curve, underfloor heating response curves, etc., etc.).
So, as stated, these did "creep in over time" (I am counting 47 at the moment) and they are never an issue until you hit the "tipping point" where the last few impact the overall performance almost exponentially ... my system has been up and running and growing for some ... 2 years or so!
I was thinking about going back in switching my "approach" from "online memory based" ui_trending to storing the values in a DB and bring them to the screen whenever I open the relevant flow in the dashboard, but that takes time in setting up / building this mechanism which I have not yet taken.
with my 47 ui charts, I am also not yet there to e.g. quickly temporarily disable all charts and see if that impact the performance as much as I think it will.
But as I stated in my first post, I have a total of nearly 8000 nodes running - I don't know if that is a big or average or even small environment but I do have challenges with my setup. AND as stated, I am not finished yet and would like to take on more load / tasks on that device!
Thanks

I tend to agree with @zenofmud regarding how often to poll data/sensors.

For a reference point on my "Pi 4 8gb" I'm running about 4500 nodes across 88 tabs at about 50% RAM usage and 10% CPU usage. All while also running HomeAssistant, Homebridge, NextCloud, Jellyfin, Grafana, Netdata, Apache, InfluxDB and mongoDB.

1 Like

Thanks @HaroldPetersInskipp!

My RPi is a 2 GB version, which I picked based on the assumption - I run it head-less, why would I need more memory (you spot the layman, right?)!?

I very much appreciate you sharing your stats! It is quite possible that my bottle neck is actually memory (and my pi is busy with swapping rather then executing code).

The air quality monitor is just a test. my average mqtt load is 0 to 2 msg/sec and I only have occasional peaks of ~35msg / sec. I have NOT narrowed it down to what might cause the issue as I didn't see this causing the main load (but maybe it is ...).

htop shows consistently nod red as the "top consumer":

I have grafana and influx db also running in the background but they don't do anything yet. My homematic installation runs on another pi but it brings in "all values" as default of which I am maybe only using 1% ... not sure if that could be somehow limited but my aim would be in the long rung to completely move away from homematic and switch all devices over to something else ... but that will take time.

I am also running a usb / serial connection to my home built arduino based alarm system, but again, on average only 1 msg/min (but peaks, when something happens).

I also run a couple of Web based services to 2 weather (forecast) services, operate my wallbox ev charger via their web UI (one call every 30 seconds) and have our BMW i3 connected for charging control and pre-conditioning (via python script, which when it triggers runs for a longish time but I don't think the processing load is high though) and showing the location of the car on a map. I am also fiddling around with our hybrid Merc via WebAPI but that is not yet up and running.

My pi zero based front door web came is dumping an image each second on the PI's SSD which is then further processed by logic in my home automation system (when an event triggers, I can se the previous 20 seconds of activity and send potential telegram message, email, and long term archiving of "motion events").

I also have 4 web api based shelly dimmers connected via shelly nodes. I have no idea about their "load".

As I don't have homeassist I do all lights and ventilation "automation" with manual "logic". I am heavily using norelite for that and as cool as it is, I have my suspicion that it is also cpu intensive ...

I also communicate to 3 Google home devices and check the availability of some (core) appliances frequently (door bell down, nas down, front came not available, pi-hole going down etc, etc.).

Long term trending is done via sysvar to the homematic based historian. I'm sending some 250 event driven values for long term archiving (frequency is hard to say - some go every second, some only once an hour or maybe even less but hard to say!).

And as I had said, all "worthy" notifications are sent via telegram (and email) from where I can also control a considerable amount of devices via a self define command line logic (my VPN for remote access has only been up and running more recently).

Regarding memory I am not a linux guru - If I interpret HTOP correctly, I think it says it uses only about 50% of my 2 GB available, right?

"free" shows this:
image

When I switched form my RPi 3B to my 4B some time last year, it was a big performance boost. But with all the stuff I have been adding, I am kind of back at where I was then ... it simply annoys me when I have to wait 15 seconds before a changed flow goes life.

I dare to say my CPU average load is similar to yours with double the amount of nodes (but no homeassist or worth while grafana / db services yet running in the background).

If I would spend enough time in optimising my over the last 2 years grown installation, I am sure I could squeeze out a bit more performance, but can't see this solving my issue if I once more would like to "double the load" (my heating ebus communication and pi-hole run on a separate device, I am not yet done with further air quality monitors and the associate automation, would like to do more heating profile optimisation [currently runs mostly on the homematic thermostats but would like a more centralised approach], am planning the integration of our ring door bell, also wanted to change the communication with our ev wall charger from web api via provider website to a local ocpp bases server client architecture, etc. etc. ). And, as I did admit, I am not a javascript / linux trained programmer (actually, my history is with Simatic logic controllers, a very different beast :wink: )

If someone has a script, that can easily (temporarily) deactivate ALL ui_charts in runtime, I would be very interested to try and see if my suspicion is correct. Or if someone can confirm that memory is my culprit, I might try an 8GB Pi 4 (if they become available again ...).

But otherwise I think that my easiness way forward will be a more powerful hw platform (or yet more distributed services across other PIs which I don't want).

THANKS

I'm running on the same hardware as you and don't see any more than 1-2 sec for deploy to finish, are you doing a full deploy or just modified nodes ?

My system has also grown over the last 2 years as I have learned more and added around 50 tasmota devices, goodle and alexa integration etc.

I only have the one Pi4B 2GB with usb3 SSD which runs node-red Pi-hole dhcp grafana Chronograf influxdb telegraf ftp samba file shares DLNA media server webmin chrony time server etc etc.

I have swap set to 2GB, yours is 100M not sure if that would help you ?

I notice you seem to have more than 1 entry for node-red, I don't see that ?

thanks @smcgann99

I do just "changed nodes" and yes, from my other smaller node-red projects (on other devices) I am used to the "instant deploy" time frame ... it was like that when I initially switched to the Pi 4 last year, but over time, it got more and more sluggish. When I am in the editor and I hit F5/refresh it takes about 15 seconds for the on screen to reload.

Regarding swap size to 2GB ... isn't that in my case counter intuitive? I thought I should avoid swap files if I am concerned with performance? And as I said, I am not even sure how my memory usage is ... (besides the two tests I did).

Question - if I disable swap altogether AND memory is my issue, will node red crash or warn me in some way or simply start to restart? That might be the quickest way for me to find out, right?

Regarding multiple instance ... yes, I noticed that myself in the past that in some cases, there are 4, 5 even 6 lines tagged "node red". I am not aware of anything "funny" that I do. I have the auto-launch feature enable, so when my raspberry pi boots, everything starts automatically. Could it be multiple processes running in parallel? E.g. I mentioned the python script for my BMW i3 web api call that, when triggered will run for 10, 15 seconds I would say, but it does not stop other flows executing when that happens?! But I am completely guessing ... having said that, I do count 3 node-red instances in your screenshot (thanks for sharing!).

Thanks

I see you are using influxdb. Are you writing influx data to the SD card?

Run
sudo iotop
and see if processes are getting held up by access to IO

Thanks @Colin
I am booting from SSD and I don't think I consciously would have mounted the SD card, so my instinct tells me No, I don't write to the SD memory card.

Regarding influxdb - it is not yet set up, just installed. The test nodes in my flow are disabled.

Thanks for the tip with iotop. I used it with the -o option and here are a couple of screenshots:

image

image

The sftp server I would guess is the front door webcam dumping an image every second.

syslog - I presume my logging to the NAS drive! but that shouldn't be a local write rather via the network.

For the most time, it "sits" however like this:
image

I had to wait some time to see the other processes popping up and capturing them...

Thanks

As a matter of principle I would disable influx and grafana if they are not yet setup, who knows what the default config might be doing.

What does iotop show if you start a deploy? Similarly what does htop show when you start a deploy?

Also, if you restart node red does the amount of memory it is using increase significantly over time?

The fact that you have a number of node-red processes is unusual. I think that means that you have a number of spawned system stuff such as IO access, possibly networking, and so on.

Are you running the browser on the pi? If so does it make a difference if you close that and run it from a different machine?

Hi @Colin,
I had been playing around with a flow to get a better understanding of both grafana and influxdb but I had not fully "figured it out yet" (following node red examples and YouTube videos). For now, I have stopped both services (and found VNC server running as well, left over from early days). Did it make a difference - it is very hard to say! Generally, since starting this AM but without making any major changes, the cpu load seems to have quieted down a bit (as if it knows that we are watching it :wink: ) but the last 4 hours don't stand out when comparing with the last 36 hours:

At the moment, deploy changes have improved from about 15 sec when tested this AM to about 12 seconds just now. Same symptom of about 7 or so seconds of "freeze" / nothing followed by the "visible" deploy.

I took a couple of screenshots of iotop and htop, first one with node red editor refresh:

Next one with deploy, after about 2 seconds of hitting the button:

and the last one after about 8 sec of hitting the deploy button:

Regarding restart:

  • My gut feeling is that deploying takes the same time, when I have rebooted the pi or if it has been running for a couple of weeks.
  • The memory gauge (triggered every 10 sec) stays pretty much always in the same spot around the 50% utilisation mark (could be 48% one day and 52% another - I only started a long term trend today ... will know in a couple of days if there is a big variance).
  • On a bad day, node red might restart itself twice. I have not yet found the time when it happens to properly investigate what might cause it. And this double restart could be followed by 4 weeks of uninterrupted running without any changes made. I have not found / understood the patter, what triggers a "bad day".

Regarding several processes - I was watching HTOP when I triggered the update from the BMW via python web api call, which runs for ... several seconds (10s?) and I can see a node red thread taking on more cpu, followed by the python script executing.

Regarding browser - no, I am running headless. The browser screenshots have been made on my laptop.

Many thanks,
Robert

OK putting aside the question (which others are addressing with you) if you should upgrade, I run my Node Red instance on a Virtual machine running in a small cluster.

The reasons for a Virtual machine

  1. I can snapshot (and do) Node Red whenever i want (which is every hour)
  2. I can run an online backup each evening of the system and then ship that to another machine in the cluster
  3. I can clone the VM each weekend whilst online which i do and then add all the snapshots to this clone during the week (so i have a fallback for my NR instance no more than 1 hour old at any point) and can bring that live with two simple commands in the event of a failure of the primary system.

My Cluster consists of 3 x HP Desktop PCs (intel 4570 CPUs) with 32Gb RAM that run about a dozen virtual machines for my home lab - total power draw for all 3 across a 24 hour period = 2.4KW = 100W per hour

Obviously this is not something that everyone would want (or need) but NR runs my whole house so it is pretty important - and happens to work in well with the other systems that i run for my business.

I believe Julian runs his on an old laptop - many of which will idle along at no more than 20w and will give you lots of options for adding additonal containers and the like.

Craig

Your use cases may also require some considerations, especially if you have, or will have, need for machine learning or other AI processing. In my case AI for object detection in video streams from cameras. You should then select a platform powerful enough for the task. Actually, having a strong GPU, like a graphic card from Nvidia (in my case, I run my home automation with video analytics in a Nvidia Jetson Nano, there are much better ones available but the price/performance was good at the time when I purchased it)

Thank you @craigcurtin for sharing your setup! Really impressive! If I would still be running my business from home, I would definitely consider a similar approach! I assume you have your storage done via that cluster as well, which would take away another two NAS from my setup, each consuming 10 to 15W as well!
Regarding availability - well, we have some wall switches from where you can still turn on an off some lights (but not all of them - the other day, I have two IKEA lights which were dropped from my zigbee2mqtt gateway for no apparent reason and I was no longer able to turn them off manually when going to bed!). But the e.g. heating depends to 100% on the availability of not just one but two devices, the homematic raspberrymatic along with my node red home central ... however, we live in Ireland, so a heating failure will cause certain reprimand from my wife (and kids) but it is NOT a live or death situation as in some other countries ...

Thanks @krambriw, also some worthwhile considerations! I would have never thought of issuing a headless setup with a powerful graphic card but yes, new applications (AI) have new requirements! The analysis of (various?) video / image streams to trigger specific actions could be interesting. And regarding automation, I was thinking about the use of "AI" (?) to start recognise patterns to trigger actions (e.g. recognise what "it" looks like when the washing machine is finished, where ours keeps on turning the drum in regular intervals after it finished so a "zero current" detection will NOT do the trick!).
Thanks!

Yep but then your want to keep power low (with a high end video card) goes out the window - i would instead look at one of the Coral type USB sticks if that was what you wanted

Craig

Hi Robert,

I have some Raspberry PIs running similar workloads and don't get to the limits when it comes to CPU power. 2GB of memory does seem a bit on the low side though. Even though Nodered might not use a lot of memory, other tasks on the system might push it over the threshold. Unscheduled restarts might indicate a problem (I have none of those).

I really like the raspberry pi platform, but if you were to look elsewhere, I can recommend Intel NUC. They are small reliable systems that don't require a lot of power and come with Intel CPUs, which offer a lot more performance than the Raspberry has.

If you were to consolidate your PIs, this could be a good platform.

Good luck in your search :slight_smile:

Hi @steirx,
I would suggest sticking to the Pi too, and look for the real bottleneck. If there is a software issue, most probably a more powerful platform would just delay its effects, but they'll show up again.

Then, if you want to add some reliability to your setup, you may consider something like Strato Pi and take advantage of its stabilized power supply, hardware watchdog, UPS, RTC, etc... there's also a Node for it (which I maintain :slight_smile:)

Ciao,
Giampiero