how many devices can be connected to one dashboard or with one computer running node-red?
Hi, welcome to the node-RED forum.
That depends... what type of devices? how are they connected? what is the computer's performance? what QoS is acceptable?
Why don't you describe what your project is, with as much detail as possible.
I thank you a lot for helping me
my project is a hospital I have more than 80 fan coil thermostats and 10 PLCs connecting to pumps, exhaust fans, level sensors, some VFDs and 3 generators all are Modbus serial RTU devices I must connect them to Modbus RTU / Modbus TCP Gateway and then to an Ethernet Switch for making a BMS system using NODE-RED .
is it possible to use node-red if I use a high-performance computer?
Short answer yes.
Long answer, it depends how you architect it. And don't forget you can have more than 1 node-red running on 1 or more computer. I'm my previous role 1 server was barely using more than 10% CPU running 5 instances.
I thank you a lot for helping
1-but how can have more than one node-red on one computer?
2-is one node-red enough for my project?
thanks
Search the forum for multiple instances.
It is impossible to say without precise information. What speed will you poll PLC's? How many data points? What size data points? What CPU will server have? Will it run other services? What network speeds do you have. What it's the interface speed on the end devices? How busy are the networks? Will you be saving data in a database? What kind of database? The list goes on and on and on and on.
Even if you knew all the answers - no one could even compute the answer for you!
The only answer I can give you is yes, it will work. Possibly with one node-red. Maybe 2. Maybe 10. I don't know, but you scale out until it does work!
THANK YOU A LOT
i have 9 Modbus RTU/TCP gateways every one of them have one Modbus RTU network with 16 devices(address stations) and 10 plc each with 24 digital input outputs and 12 analog sensors connecting with the PLCs and I have a dedicated VLAN for this project inside a strong ethernet network(100MB FAST ETHERNET PORTS) with bringing a very good server but I am not sure about its model yet
Why would you want to go with node-red for a system at a hospital? You have a (I guess) industrial grade setup with VFDs PLCs etc, wouldnt it be better to do what you want in a PLC/SCADA whatever?
I use the software of the PLC for the PLCs but for monitoring and controlling all the things I want to use Node-RED because it's so powerfull, open sourse and free to use and have lots different and powerfull nodes.
So if it's possible it will be great.
Thanks a lot
Agree with Steve. It is doable but you need very careful planning.
You may also want to look into data storage when you get data in. You may need a database to store the status of each devices and their I/O and sensors.
We are seeing more and more of this kind of use in many industries. In my own world, a large outsourcer we work with has recently pitched a monitoring "bridge" solution that includes potentially multiple instances of Node-RED acting as glue between various data sources and a data lake implemented using the ELK stack.
Absolutely possible. But yes, as Steve and David have said, do not assume that any software, let alone open source, will be a simple install and forget. It needs architecting indeed with the usual disciplines applied such as resilience, performance, monitoring, security, documentation, ...
THe good news is that Node-RED is not only capable but also remarkably stable in operation. So it can fit well into a resilient architecture with good design and planning.
Thanks to you for helping
I appreciate your effort
Thanks a lot for all of these informations and explanations
I appreciate your effort
In a past life I spent 18 years automating a hospital with PLC's etc.
An important aspect that sets off major warning bells for me is the dashboard limitation of Node-RED.
See this thread for a great insight on how it really only supports 2-3 users:
If running a few instances of Node-RED also helps address this limit, I have no idea how it could be built / made to work as one seamless dashboard.
Interface the dashboard to the control logic via MQTT. Then you can run as many different copies of the dashboard flows in separate node-red installs as you like. In fact you can put the dashboard flows on separate computers if you want to, communicating via MQTT back to the controlling device.
Im missing how adding MQTT addresses having each dashboard on a different port number (same computer IP address) and yet the user is not aware that the IP:port they are connected to is serving the dashboard pages from the different port numbers?
This was my core question about splitting up Node-RED to handle more users/data.... You want the user to not be aware or have to manage each instance when they are using the dashboard.
You are right, different users would have to connect to different instances of node-red. I didn't realise that is what you meant by seamless. My suggestion will be seamless in the operational sense, all the dashboards will function identically, but they will have to connect to different ports. I believe there are technologies to cope with that sort of load sharing, but I don't know about them.
If dashboard starts to die due the heavy traffic over the socket just see if you can reduce the data to minimum.
When it was introduced that dashboard nodes can figure out the data from any property of the payload, it was kind of double-edged sword.
![]()
See the example :
[
    {
        "id": "adbdcd11d1d9de24",
        "type": "function",
        "z": "88085c2cbfdc52d0",
        "name": "generate data",
        "func": "const generateFromString = (s) => {return s.split(' ')}\nmsg.payload = {    \n    usableData: {\n        data:Math.random()*100\n    },\n    trashData: {\n        array: generateFromString('Lorem ipsum dolor sit amet, consectetur adipiscing elit. Praesent quis fringilla elit. Cras placerat, nisi non aliquet venenatis, arcu dolor tempor diam, a condimentum lectus odio auctor justo. Maecenas placerat massa quis sem efficitur fringilla. Aliquam suscipit, augue quis maximus finibus, metus elit sodales neque, sit amet sagittis lacus diam nec justo. Donec non ex aliquam, tempus ante sed, finibus nibh. Pellentesque augue lectus, tempor sit amet ante a, pharetra hendrerit tellus. Nunc varius quis lorem sit amet viverra. Nam faucibus et enim vitae iaculis')\n    }\n}\nreturn msg;",
        "outputs": 1,
        "noerr": 0,
        "initialize": "",
        "finalize": "",
        "libs": [],
        "x": 390,
        "y": 1070,
        "wires": [
            [
                "a269b6b475fdb4ce",
                "6439bee9186d1fb0",
                "0d4215f0e26b258a"
            ]
        ]
    },
    {
        "id": "5cbce4541195c499",
        "type": "inject",
        "z": "88085c2cbfdc52d0",
        "name": "",
        "props": [
            {
                "p": "payload"
            },
            {
                "p": "topic",
                "vt": "str"
            }
        ],
        "repeat": "15",
        "crontab": "",
        "once": false,
        "onceDelay": 0.1,
        "topic": "",
        "payload": "",
        "payloadType": "date",
        "x": 210,
        "y": 1070,
        "wires": [
            [
                "adbdcd11d1d9de24"
            ]
        ]
    },
    {
        "id": "a269b6b475fdb4ce",
        "type": "debug",
        "z": "88085c2cbfdc52d0",
        "name": "full data",
        "active": true,
        "tosidebar": true,
        "console": false,
        "tostatus": false,
        "complete": "payload",
        "targetType": "msg",
        "statusVal": "",
        "statusType": "auto",
        "x": 610,
        "y": 990,
        "wires": []
    },
    {
        "id": "6439bee9186d1fb0",
        "type": "ui_gauge",
        "z": "88085c2cbfdc52d0",
        "name": "",
        "group": "850a3f9459a15f60",
        "order": 0,
        "width": 0,
        "height": 0,
        "gtype": "gage",
        "title": "gauge",
        "label": "units",
        "format": "{{msg.payload.usableData.data | number:1}}",
        "min": 0,
        "max": "100",
        "colors": [
            "#00b500",
            "#e6e600",
            "#ca3838"
        ],
        "seg1": "",
        "seg2": "",
        "className": "",
        "x": 600,
        "y": 1030,
        "wires": []
    },
    {
        "id": "0d4215f0e26b258a",
        "type": "change",
        "z": "88085c2cbfdc52d0",
        "name": "",
        "rules": [
            {
                "t": "move",
                "p": "payload.usableData.data",
                "pt": "msg",
                "to": "payload",
                "tot": "msg"
            }
        ],
        "action": "",
        "property": "",
        "from": "",
        "to": "",
        "reg": false,
        "x": 690,
        "y": 1070,
        "wires": [
            [
                "3e731b34c7152380",
                "f420e23014cfcfca"
            ]
        ]
    },
    {
        "id": "3e731b34c7152380",
        "type": "ui_gauge",
        "z": "88085c2cbfdc52d0",
        "name": "",
        "group": "850a3f9459a15f60",
        "order": 0,
        "width": 0,
        "height": 0,
        "gtype": "gage",
        "title": "gauge",
        "label": "units",
        "format": "{{value | number:1}}",
        "min": 0,
        "max": "100",
        "colors": [
            "#00b500",
            "#e6e600",
            "#ca3838"
        ],
        "seg1": "",
        "seg2": "",
        "className": "",
        "x": 930,
        "y": 1070,
        "wires": []
    },
    {
        "id": "f420e23014cfcfca",
        "type": "debug",
        "z": "88085c2cbfdc52d0",
        "name": "actually needed data",
        "active": true,
        "tosidebar": true,
        "console": false,
        "tostatus": false,
        "complete": "payload",
        "targetType": "msg",
        "statusVal": "",
        "statusType": "auto",
        "x": 980,
        "y": 1030,
        "wires": []
    },
    {
        "id": "850a3f9459a15f60",
        "type": "ui_group",
        "name": "Default",
        "tab": "58b2b959bc1d8c20",
        "order": 1,
        "disp": true,
        "width": "6",
        "collapse": false,
        "className": ""
    },
    {
        "id": "58b2b959bc1d8c20",
        "type": "ui_tab",
        "name": "Home",
        "icon": "dashboard",
        "disabled": false,
        "hidden": false
    }
]
Using developer tools and observe WS messages
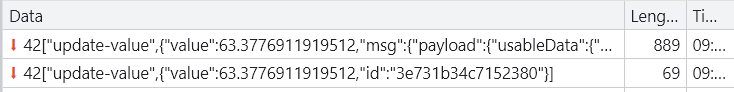
Of course it does not help for charts where data-points are the needed part but even then, if the msg contains some properties what are not needed for dashboard, those should be removed.
Hi,
look here are some examples of node red and how powerful it is.
I work for years now with node red in an industrial environment and i am pretty sure you can run your project on an raspberry pi. But if you go with a hardware about 400-500$ you will be fine.
You will just have a few datapoints, maybe ~2000 and dont have to poll them every millisecond.
Think about what information you REALY need, how often you realy need them and keep your dashboad smal and simple.
If you buy a professional scada system or whatever your can work many, many month on NR and try you things, if you have the time to do so.
The last years i ofthen reached points where i thougt i cant go forward, but i always found a way to get my ideas to work.
So good luck for you project.
That is a good point that had not occurred to me before, that in the circumstance you describe the whole object will be passed to the dashboard. Most of the time that will not be significant, but for a widget that is being updated rapidly, if the object containing the data of interest is large, it could be a significant factor. It is certainly something worth bearing in mind when using angular filters in a widget.