Dear sir
I can see the line chart function in the flow editor, and there is only one data source for Y axis, and the X axis seems to always be the time or points, what if I want to relate the X axis to another data node? How can I achieve this feature.
How can I achieve several line curves at one chart, which means several series for Y values tied with one X axis.
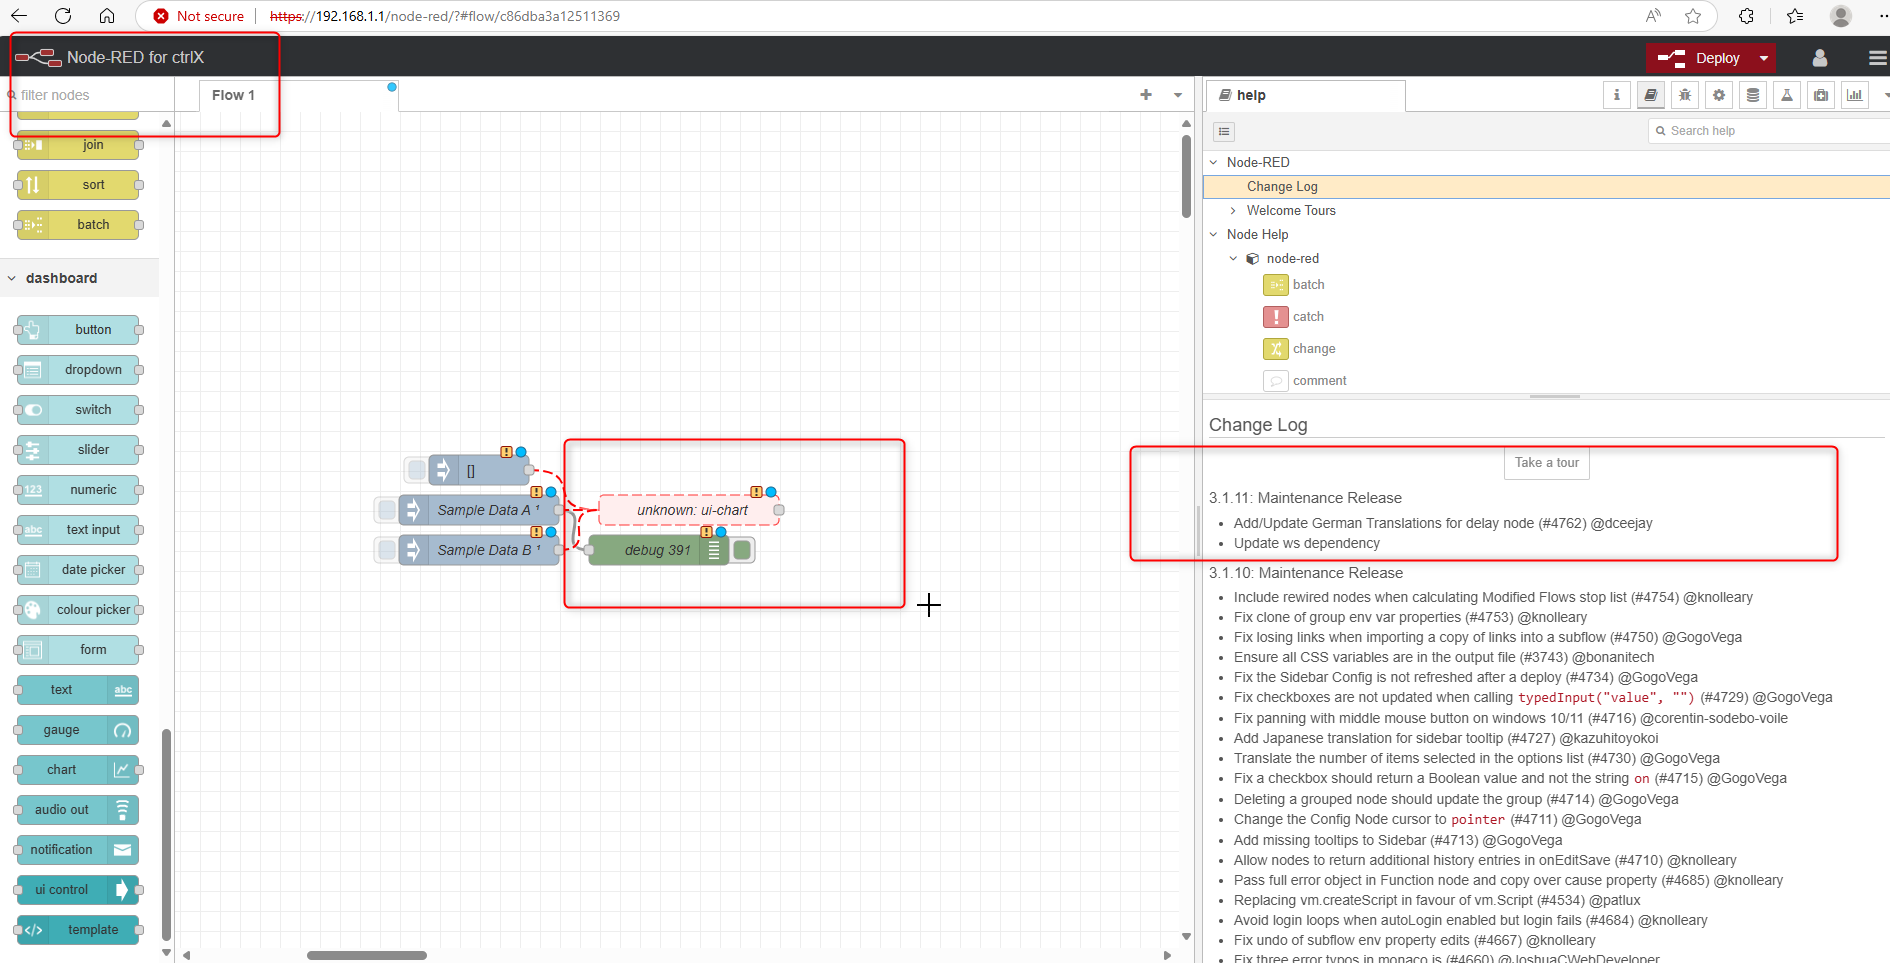
Hi, actually, I am the developer from Rexroth ctrlX platform, and I am using the node-red app from this platform, I am not really sure which version node-red I am using. I can only see the version description from flow editor, which is v3.1.11.
And when I importing the example chart json data from Dashboard 2.0, it is incompatible, so I guess the version I am using is not dashboard 2.0
Yes, the nodes you have on the left-side palette are the (now deprecated) original Node-RED Dashboard. The flow you have is using a node from FlowFuse Dashboard (ak.a. Node-RED Dashboard 2.0, the official successor)
By "draw free line in the line chart" I guess you mean "present a virtual series like a target line or trend line"?
Just as you prepare and send database data to a chart you can mix in any other series of virtual/computed data you desire.
If you truly want to draw non series type annotations then you need to import a lib like eCharts which has a very rich API and D.I.Y it
There is an example flow on the forum for importing and using eCharts. To manipulate it further, you will need to read the eChart docs and pay with it in their playground. Here is one that renders a custom trend line: Examples - Apache ECharts
By draw a free line in chart, I mean the user can use the mouse to click on the chart, the chart can get the first click position(x, y) of the chart, then the user click a second position, the line starts from fisrt position to second position is drawn automatically by flowchart, and the click position can be stored as json data type in my backend.
Same thing. You will need to use something more sophisticated like eCharts. Capture click events, draw custom points and send({payload:YOUR_NEW_DATA}) to the serverside (Node-RED) where you can store it or whatever you need to do.
Anything is possible, limited only by imagination and skill But, I am unaware of anything out of the box with this kind of functionality. Have a hunt around the forum, you might get lucky.
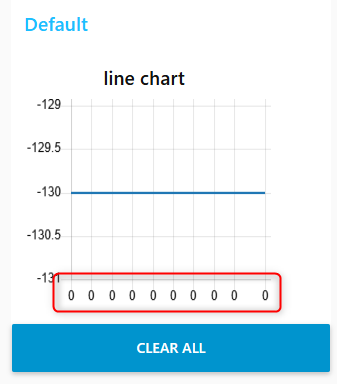
Hi, there is a problem I found with the chart node, which is that the X axis data is binding with string label.
In the case that X data is getting smaller, the X axis will start at big value and end at small value, like below:
What if I want the X axis data is binding with numeric data, so that no matter what kind of data in X array data, the X axis value will always arrange from small to large.
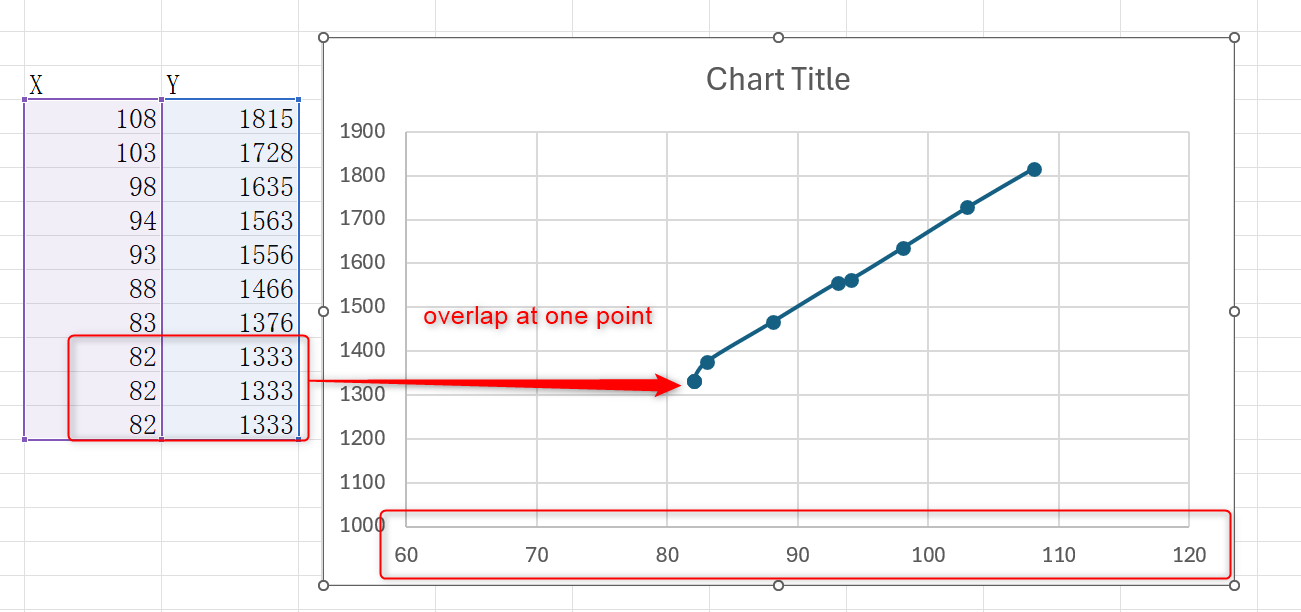
And because the X source data is using the label to describe the X axis, if the X value is duplicate, the chart can not combine the same X data in one point. What I want is the X data is described as a numeric type, so the X/Y data will automatically overlap in one point when the X/Y values are the same.