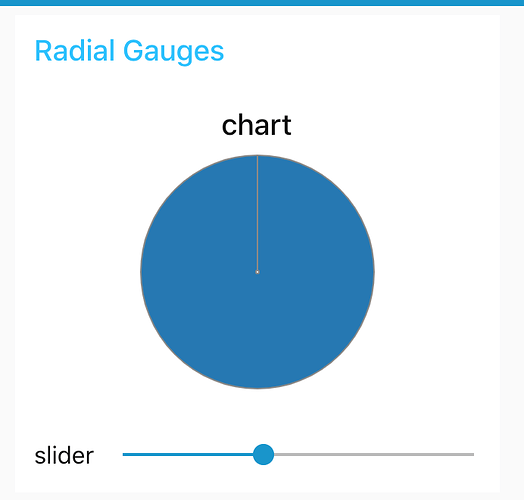
Here it goes, just want to point out that i made this one at home just for testing purposes. I don't really have access to the one i'm building.
[{"id":"359f4766.71db78","type":"ui_template","z":"a66870f1.66458","group":"ad421a6d.0cd738","name":"Dashboard stylesheet","order":1,"width":0,"height":0,"format":"<style>\n/*\nIt is reasnoble to declare the colors as CSS variables\nso they can be easily called by name where needed.\n\nYou can see that in many places the variables are not used. Change it!\n*/\n\n:root {\n --color-green-primary: rgb(51, 204, 51);\n --color-green-secondary: rgb(26, 101, 26);\n --color-red-primary: rgb(255, 0, 0);\n --color-red-secondary: rgba(153,0,0,1);\n --color-gray-primary:rgba(40,40,40,1);\n --color-gray-secondary:rgba(65,65,65,1);\n --color-text-primary: rgb(230, 226, 209);\n --color-widget-border: rgb(84, 78, 78);\n}\n\n/*\nAll CSS adjustments are commented out.\nTurn rules on one by one and see the changes.\nDon't use too many elements cos it wil be confusing\nStart with simple elements like text, slider or button\n\nMany of elements like buttons have states, \nthose rules must be found and adjusted also.\n*/\n\n\n.masonry-container {\n position: relative;\n width: 100%;\n height:100%;\n margin: 0 auto;\n background: rgb(255,0,0);\n background: linear-gradient(180deg, var(--color-gray-primary) 0%, var(--color-gray-secondary) 100%);\n}\n\n\n\n.nr-dashboard-cardcontainer {\n position: relative;\n box-shadow: inset 0px 1px 4px 0px #000000bb;\n border-radius: 15px;\n}\n\n.nr-dashboard-theme ui-card-panel {\n background-color: #33333300;\n color:var(--color-text-primary);\n border-radius: 15px;\n box-shadow: 0 0 8px 0px #00000080;\n}\n\nbody.nr-dashboard-theme md-content md-card {\n background-color: #33333300;\n color: var(--color-text-primary);\n text-shadow: 4px 2px 4px #00000045;\n box-shadow: 0 -1px 5px 1px #00000045;\n border-radius: 12px;\n border: 1px solid var(--color-widget-border);\n}\n\ncanvas {\n style: \"20\";\n}\n\n.nr-dashboard-theme ui-card-panel p.nr-dashboard-cardtitle {\n color: var(--color-text-primary);\n}\n\n.md-button {\n display: inline-block;\n position: relative;\n cursor: pointer;\n min-height: 36px;\n min-width: 88px;\n line-height: 36px;\n vertical-align: middle;\n align-items: center;\n text-align: center;\n border-radius: 12px;\n box-sizing: border-box;\n -webkit-user-select: none;\n -moz-user-select: none;\n -ms-user-select: none;\n user-select: none;\n outline: none;\n border: 0;\n padding: 0 6px;\n margin: 6px 8px;\n background: transparent;\n color:var(--color-text-primary);\n white-space: nowrap;\n text-transform: uppercase;\n font-weight: 500;\n font-size: 14px;\n font-style: inherit;\n font-variant: inherit;\n font-family: inherit;\n text-decoration: none;\n overflow: hidden;\n transition: box-shadow .4s cubic-bezier(.25,.8,.25,1),background-color .4s cubic-bezier(.25,.8,.25,1);\n}\n\n\n.nr-dashboard-theme .nr-dashboard-button .md-button {\n background-color: #88888800;\n color:var(--color-text-primary);\n}\n\n.nr-dashboard-theme .nr-dashboard-button .md-button:hover {\n background-color: #88888855;\n}\n\nmd-slider .md-thumb {\n z-index: 1;\n position: absolute;\n left: -10px;\n top: 14px;\n width: 20px;\n height: 20px;\n border-radius: 20px;\n -webkit-transform: scale(.7);\n transform: scale(.7);\n transition: all .4s cubic-bezier(.25,.8,.25,1);\n box-shadow: 0 0 6px #00000070;\n}\n\n*/\n\n/*\nAdvanced stuff - dynamic change of card CSS\n\nClasses here can be used to make colored stripe at the top of card\nUsage is not in here, but they are added to md-card when needed within another template\n\n.carderr {\n background: rgb(255,0,0);\n background: linear-gradient(180deg, var(--color-red-primary) 0px, var(--color-red-secondary) 3px, rgba(80,80,80,1) 4px, rgba(45,45,45,1) 100%);\n}\n.cardok {\n background: rgb(39,255,0);\n background: linear-gradient(180deg, var(--color-green-primary) 0px, var(--color-green-secondary) 3px, rgba(70,70,70,1) 4px, rgba(40,40,40,1) 100%);\n}\n*/\n\n</style>\n\n<script>\n var canvas = document.getElementsByTagName('canvas');\n canvas.width = 800;\n canvas.height = 600;\n</script>","storeOutMessages":true,"fwdInMessages":true,"resendOnRefresh":false,"templateScope":"global","x":420,"y":360,"wires":[[]]},{"id":"ad421a6d.0cd738","type":"ui_group","z":"","name":"Radial Gauges","tab":"2a0ea3c6.c5bb0c","order":2,"disp":true,"width":"6","collapse":false},{"id":"2a0ea3c6.c5bb0c","type":"ui_tab","z":"","name":"Widgets","icon":"dashboard","order":2,"disabled":false,"hidden":true}]


