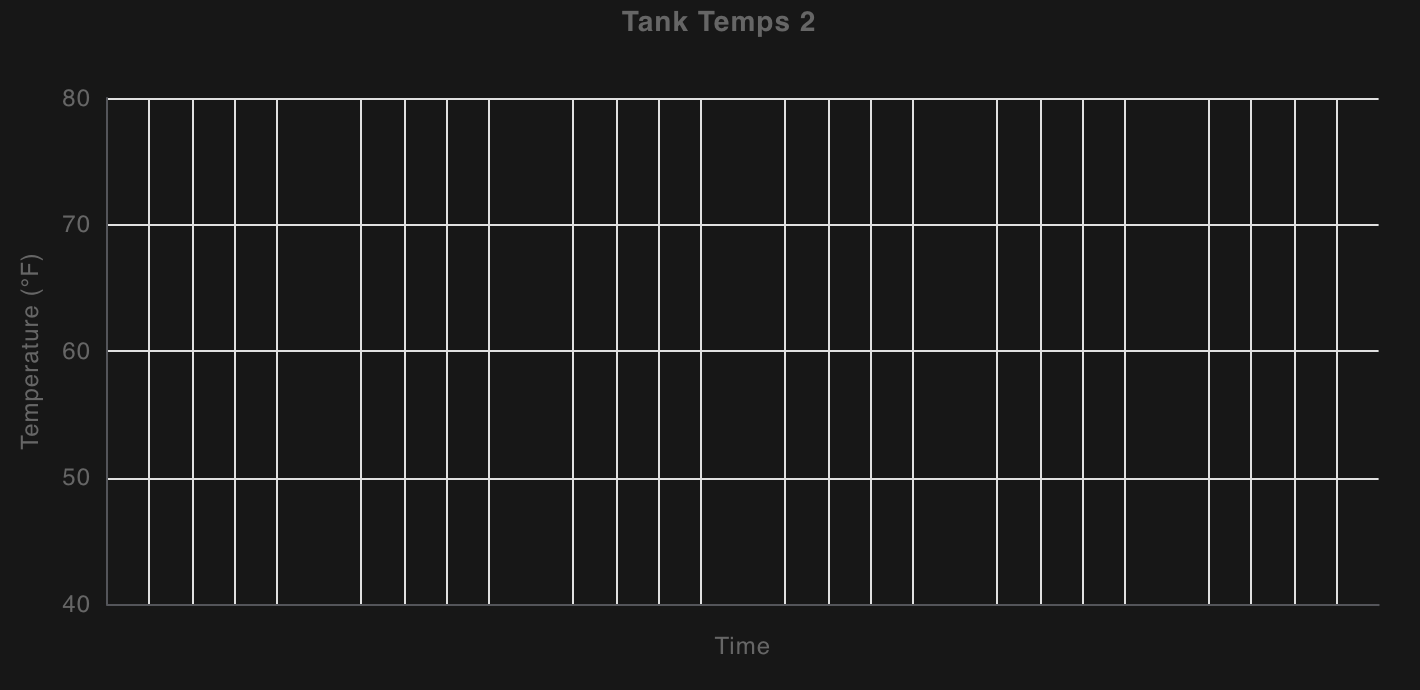
I’m having troubles pulling data from InfluxDB2.0 into a Dashboard2 Chart. Below is the flow I’m using. The debug output is below and below that is the current chart view (which shows nothing). Any ideas on what I’m doing wrong here?
[{"temperature":57.849999999999994,"time":"2025-09-15T17:30:00Z","tank":"TankTemp-T13"},{"temperature":57.89999999999999,"time":"2025-09-15T17:40:00Z","tank":"TankTemp-T13"},{"temperature":57.989999999999995,"time":"2025-09-15T17:50:00Z","tank":"TankTemp-T13"},{"temperature":58,"time":"2025-09-15T17:53:57.749092Z","tank":"TankTemp-T13"}]
[
    {
        "id": "7b59e5a8eeda12b2",
        "type": "inject",
        "z": "11222a8aeb7f7774",
        "name": "",
        "props": [
            {
                "p": "payload"
            },
            {
                "p": "topic",
                "vt": "str"
            }
        ],
        "repeat": "",
        "crontab": "",
        "once": false,
        "onceDelay": 0.1,
        "topic": "",
        "payload": "",
        "payloadType": "date",
        "x": 120,
        "y": 1580,
        "wires": [
            [
                "c1b807007edb6bc1"
            ]
        ]
    },
    {
        "id": "c59b9e5d70a60588",
        "type": "debug",
        "z": "11222a8aeb7f7774",
        "name": "debug 20",
        "active": true,
        "tosidebar": true,
        "console": false,
        "tostatus": false,
        "complete": "payload",
        "targetType": "msg",
        "statusVal": "",
        "statusType": "auto",
        "x": 780,
        "y": 1540,
        "wires": []
    },
    {
        "id": "5c31ca13ff9d0692",
        "type": "influxdb in",
        "z": "11222a8aeb7f7774",
        "influxdb": "2e2baf68b726c3bb",
        "name": "Ferment",
        "query": "",
        "rawOutput": false,
        "precision": "",
        "retentionPolicy": "",
        "org": "VinesRushes",
        "x": 440,
        "y": 1580,
        "wires": [
            [
                "c90cf201b7b5f2d8"
            ]
        ]
    },
    {
        "id": "ee8b6babee924d2c",
        "type": "ui-chart",
        "z": "11222a8aeb7f7774",
        "group": "a45d37e67f62923e",
        "name": "",
        "label": "Tank Temps 2",
        "order": 1,
        "chartType": "line",
        "category": "payload.tank",
        "categoryType": "msg",
        "xAxisLabel": "Time",
        "xAxisProperty": "payload.time",
        "xAxisPropertyType": "msg",
        "xAxisType": "time",
        "xAxisFormat": "",
        "xAxisFormatType": "auto",
        "xmin": "",
        "xmax": "",
        "yAxisLabel": "Temperature (°F)",
        "yAxisProperty": "payload.temperature",
        "yAxisPropertyType": "msg",
        "ymin": "40",
        "ymax": "80",
        "bins": 10,
        "action": "replace",
        "stackSeries": false,
        "pointShape": "circle",
        "pointRadius": 4,
        "showLegend": true,
        "removeOlder": 24,
        "removeOlderUnit": "3600",
        "removeOlderPoints": "",
        "colors": [
            "#0095ff",
            "#ff0000",
            "#ff7f0e",
            "#2ca02c",
            "#a347e1",
            "#d62728",
            "#ff9896",
            "#9467bd",
            "#c5b0d5"
        ],
        "textColor": [
            "#666666"
        ],
        "textColorDefault": true,
        "gridColor": [
            "#e5e5e5"
        ],
        "gridColorDefault": true,
        "width": 6,
        "height": 8,
        "className": "",
        "interpolation": "linear",
        "x": 800,
        "y": 1580,
        "wires": [
            []
        ]
    },
    {
        "id": "c90cf201b7b5f2d8",
        "type": "function",
        "z": "11222a8aeb7f7774",
        "name": "function 13",
        "func": "// Initialize the output array\nlet temp = [];\n\n// Check if msg.payload is an array\nif (Array.isArray(msg.payload)) {\n    msg.payload.forEach(function (data) {\n        // Ensure required fields exist\n        if (data[\"_value\"] !== undefined && data[\"_time\"] !== undefined) {\n            temp.push({\n                temperature: data[\"_value\"],\n                time: data[\"_time\"],\n                tank: data[\"_measurement\"]\n            });\n        } else {\n            node.warn(`Skipping invalid data: ${JSON.stringify(data)}`);\n        }\n    });\n} else {\n    node.warn(\"msg.payload is not an array\");\n}\n\n// Set the modified payload\nmsg.payload = temp;\nreturn msg;",
        "outputs": 1,
        "timeout": 0,
        "noerr": 0,
        "initialize": "",
        "finalize": "",
        "libs": [],
        "x": 610,
        "y": 1580,
        "wires": [
            [
                "ee8b6babee924d2c",
                "c59b9e5d70a60588"
            ]
        ]
    },
    {
        "id": "c1b807007edb6bc1",
        "type": "function",
        "z": "11222a8aeb7f7774",
        "name": "Query",
        "func": "msg.query=`from(bucket: \"ferment\")\n  |> range(start: -30m)\n  |> filter(fn: (r) => r._measurement =~ /^TankTemp-T13/)\n  |> filter(fn: (r) => r._field == \"value\")\n  |> aggregateWindow(every: 10m, fn: mean, createEmpty: false)\n  |> yield()`;\nreturn msg;",
        "outputs": 1,
        "timeout": 0,
        "noerr": 0,
        "initialize": "",
        "finalize": "",
        "libs": [],
        "x": 290,
        "y": 1580,
        "wires": [
            [
                "5c31ca13ff9d0692"
            ]
        ]
    },
    {
        "id": "2e2baf68b726c3bb",
        "type": "influxdb",
        "hostname": "192.168.2.14",
        "port": "8086",
        "protocol": "http",
        "database": "ferment",
        "name": "Influx",
        "usetls": false,
        "tls": "",
        "influxdbVersion": "2.0",
        "url": "http://localhost:8086",
        "timeout": "",
        "rejectUnauthorized": false
    },
    {
        "id": "a45d37e67f62923e",
        "type": "ui-group",
        "name": "Fermenting",
        "page": "082fae9e5654c821",
        "width": "12",
        "height": "1",
        "order": 1,
        "showTitle": true,
        "className": "",
        "visible": "true",
        "disabled": "false"
    },
    {
        "id": "082fae9e5654c821",
        "type": "ui-page",
        "name": "Fermenting",
        "ui": "279a246fa8c4ae76",
        "path": "/fermenting",
        "icon": "home",
        "layout": "grid",
        "theme": "34a8f0c2a227a077",
        "order": 5,
        "className": "",
        "visible": "true",
        "disabled": "false"
    },
    {
        "id": "279a246fa8c4ae76",
        "type": "ui-base",
        "name": "My Dashboard",
        "path": "/dashboard",
        "appIcon": "",
        "includeClientData": true,
        "acceptsClientConfig": [
            "ui-notification",
            "ui-control"
        ],
        "showPathInSidebar": false,
        "headerContent": "page",
        "navigationStyle": "default",
        "titleBarStyle": "default",
        "showReconnectNotification": true,
        "notificationDisplayTime": "5",
        "showDisconnectNotification": true,
        "allowInstall": true
    },
    {
        "id": "34a8f0c2a227a077",
        "type": "ui-theme",
        "name": "Dark Theme",
        "colors": {
            "surface": "#000000",
            "primary": "#0094ce",
            "bgPage": "#303030",
            "groupBg": "#171717",
            "groupOutline": "#cccccc"
        },
        "sizes": {
            "density": "default",
            "pagePadding": "12px",
            "groupGap": "6px",
            "groupBorderRadius": "4px",
            "widgetGap": "2px"
        }
    }
]