Display influxdb-2 data in dashboard-2

Hello everyone,

I have created a flow that is receiving fake temperature values (using random function) from an ESP32 using MQTT. I use influxdb v2 to store the values.

My problem is that I cannot display the last hour data in a dashboard chart, when pressing a button.

The flow that I'm using in order to display the data is

and the query is

from(bucket:"test1")
  |> range(start: -1h)
  |> filter(fn: (r) => r["_measurement"] == "test1" and r["_field"] == "temperature")

As you can see in the following image, the table shows the data but the chart doesn't.

Thank you in advance.

I cannot determine from your screenshot if the time axis is using 24h time or AM/PM, but are you sure that the time values in the table (14:31, etc.) are included in the timespan on the graph? In other words, can you expand the time window out and see any points?

Does the format of the data that you are sending to the chart match one of the valid alternatives for the chart node?

Thank you both for your time.

I'm using AM/PM in the time axis.

Here is the chart node

That looks like dashboard1 chart config, not dashboard2. I think the node colour should be changed to stop confusion,

Hello @E1cid

Isn't that a dashboard-2 node?

You're correct, see told you i find it confusing.

What is your data like , best show an example in text format.

You need to set the x and y property keys. Probably msg._time/msg._value

I'm sending the debug messages.
Is it enough for you?

I did say in text format so we can copy the data, we do not need all the array just say 5 or 6 rows.

There’s a great page in the docs (Working with messages : Node-RED) that will explain how to use the debug panel to find the right path/value to any data item.

Pay particular attention to the part about the buttons that appear under your mouse pointer when you over hover a debug message property in the sidebar.

BX00Cy7yHi

So use copy value and the edit the array down to 5 or 6 elements, then

In order to make code readable, usable and easy to copy it is necessary to surround your code with three backticks (also known as a left quote or backquote ```)

``` 
   code goes here 
```

You can edit and correct your post by clicking the pencil :pencil2: icon.

See this post for more details - How to share code or flow json

Should that be copy value?

I'm not sure that I fully understand...
Sorry about that.

I have used a text node in order to take the values of the last minute.
Is it correct?

[ { "result": "_result", "table": 0, "_start": "2024-02-25T17:36:42.18868378Z", "_stop": "2024-02-25T17:37:42.18868378Z", "_time": "2024-02-25T17:36:43.772Z", "_value": 12, "_field": "temperature", "_measurement": "test1" }, { "result": "_result", "table": 0, "_start": "2024-02-25T17:36:42.18868378Z", "_stop": "2024-02-25T17:37:42.18868378Z", "_time": "2024-02-25T17:36:48.773Z", "_value": 1, "_field": "temperature", "_measurement": "test1" }, { "result": "_result", "table": 0, "_start": "2024-02-25T17:36:42.18868378Z", "_stop": "2024-02-25T17:37:42.18868378Z", "_time": "2024-02-25T17:36:53.774Z", "_value": 15, "_field": "temperature", "_measurement": "test1" }, { "result": "_result", "table": 0, "_start": "2024-02-25T17:36:42.18868378Z", "_stop": "2024-02-25T17:37:42.18868378Z", "_time": "2024-02-25T17:36:58.774Z", "_value": 16, "_field": "temperature", "_measurement": "test1" }, { "result": "_result", "table": 0, "_start": "2024-02-25T17:36:42.18868378Z", "_stop": "2024-02-25T17:37:42.18868378Z", "_time": "2024-02-25T17:37:03.778Z", "_value": 1, "_field": "temperature", "_measurement": "test1" }, { "result": "_result", "table": 0, "_start": "2024-02-25T17:36:42.18868378Z", "_stop": "2024-02-25T17:37:42.18868378Z", "_time": "2024-02-25T17:37:08.775Z", "_value": 15, "_field": "temperature", "_measurement": "test1" }, { "result": "_result", "table": 0, "_start": "2024-02-25T17:36:42.18868378Z", "_stop": "2024-02-25T17:37:42.18868378Z", "_time": "2024-02-25T17:37:13.778Z", "_value": 15, "_field": "temperature", "_measurement": "test1" }, { "result": "_result", "table": 0, "_start": "2024-02-25T17:36:42.18868378Z", "_stop": "2024-02-25T17:37:42.18868378Z", "_time": "2024-02-25T17:37:18.78Z", "_value": 19, "_field": "temperature", "_measurement": "test1" }, { "result": "_result", "table": 0, "_start": "2024-02-25T17:36:42.18868378Z", "_stop": "2024-02-25T17:37:42.18868378Z", "_time": "2024-02-25T17:37:23.78Z", "_value": 1, "_field": "temperature", "_measurement": "test1" }, { "result": "_result", "table": 0, "_start": "2024-02-25T17:36:42.18868378Z", "_stop": "2024-02-25T17:37:42.18868378Z", "_time": "2024-02-25T17:37:28.781Z", "_value": 9, "_field": "temperature", "_measurement": "test1" }, { "result": "_result", "table": 0, "_start": "2024-02-25T17:36:42.18868378Z", "_stop": "2024-02-25T17:37:42.18868378Z", "_time": "2024-02-25T17:37:33.784Z", "_value": 3, "_field": "temperature", "_measurement": "test1" }, { "result": "_result", "table": 0, "_start": "2024-02-25T17:36:42.18868378Z", "_stop": "2024-02-25T17:37:42.18868378Z", "_time": "2024-02-25T17:37:38.784Z", "_value": 7, "_field": "temperature", "_measurement": "test1" } ]

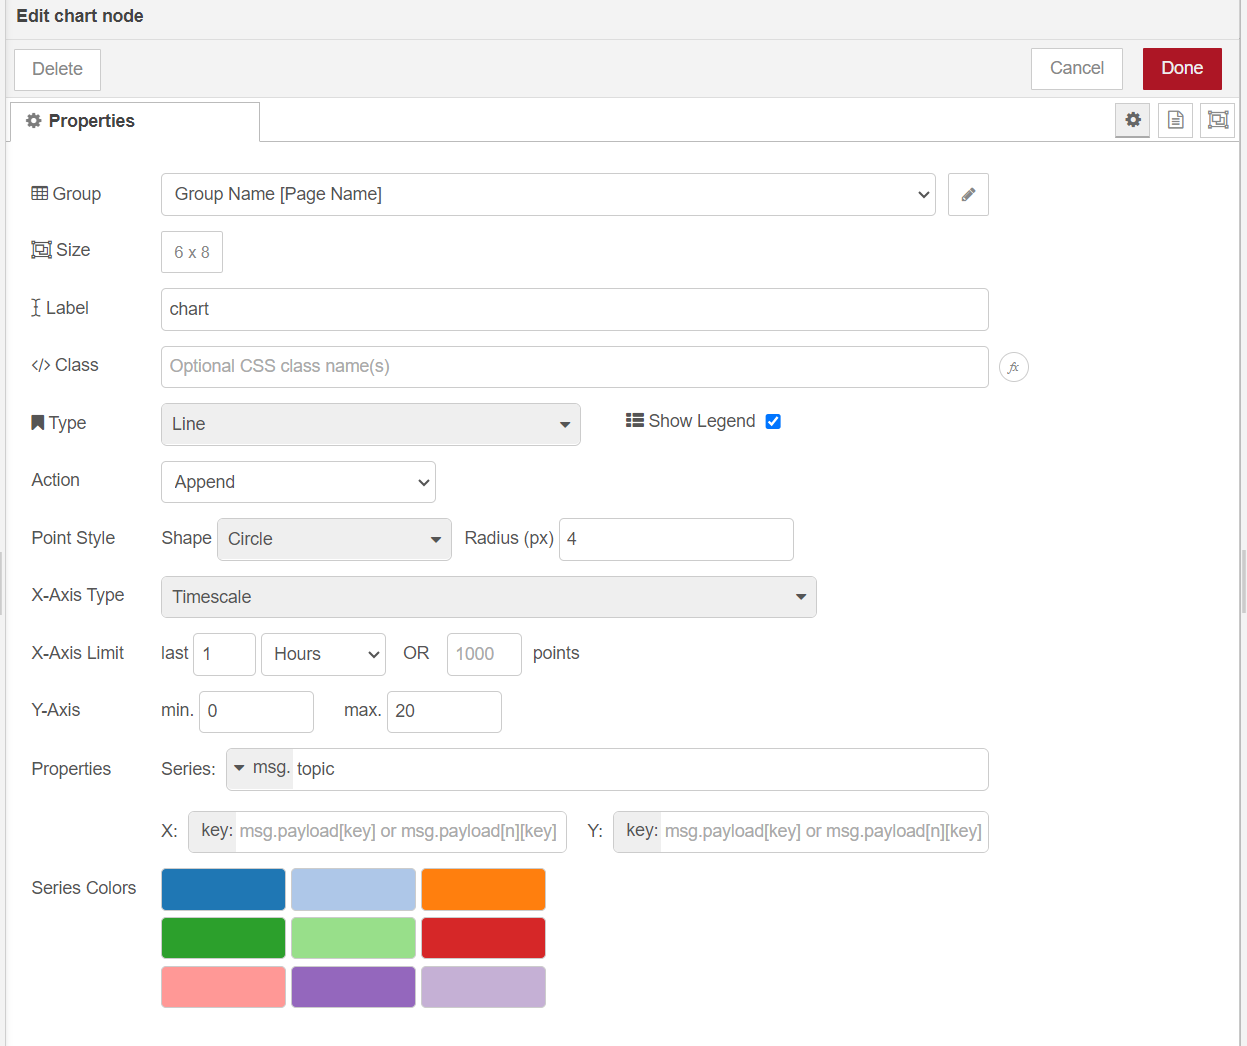
Seems the new dashboard2 chart only likes the x property in unix timestamp milliseconds
e.g.

[{"id":"1e590caec784e108","type":"inject","z":"b779de97.b1b46","name":"","props":[{"p":"payload"},{"p":"topic","vt":"str"}],"repeat":"","crontab":"","once":false,"onceDelay":0.1,"topic":"test","payload":"[{\"result\":\"_result\",\"table\":0,\"_start\":\"2024-02-25T17:36:42.18868378Z\",\"_stop\":\"2024-02-25T17:37:42.18868378Z\",\"_time\":\"2024-02-25T17:36:43.772Z\",\"_value\":12,\"_field\":\"temperature\",\"_measurement\":\"test1\"},{\"result\":\"_result\",\"table\":0,\"_start\":\"2024-02-25T17:36:42.18868378Z\",\"_stop\":\"2024-02-25T17:37:42.18868378Z\",\"_time\":\"2024-02-25T17:36:48.773Z\",\"_value\":1,\"_field\":\"temperature\",\"_measurement\":\"test1\"},{\"result\":\"_result\",\"table\":0,\"_start\":\"2024-02-25T17:36:42.18868378Z\",\"_stop\":\"2024-02-25T17:37:42.18868378Z\",\"_time\":\"2024-02-25T17:36:53.774Z\",\"_value\":15,\"_field\":\"temperature\",\"_measurement\":\"test1\"},{\"result\":\"_result\",\"table\":0,\"_start\":\"2024-02-25T17:36:42.18868378Z\",\"_stop\":\"2024-02-25T17:37:42.18868378Z\",\"_time\":\"2024-02-25T17:36:58.774Z\",\"_value\":16,\"_field\":\"temperature\",\"_measurement\":\"test1\"},{\"result\":\"_result\",\"table\":0,\"_start\":\"2024-02-25T17:36:42.18868378Z\",\"_stop\":\"2024-02-25T17:37:42.18868378Z\",\"_time\":\"2024-02-25T17:37:03.778Z\",\"_value\":1,\"_field\":\"temperature\",\"_measurement\":\"test1\"}]","payloadType":"json","x":150,"y":4860,"wires":[["001081e723930cef"]]},{"id":"001081e723930cef","type":"change","z":"b779de97.b1b46","name":"","rules":[{"t":"set","p":"payload","pt":"msg","to":"$$.payload ~> |$|{\"_time\":$toMillis($._time)}|","tot":"jsonata"}],"action":"","property":"","from":"","to":"","reg":false,"x":220,"y":4920,"wires":[["58069540b7e65fbf"]]},{"id":"58069540b7e65fbf","type":"ui-chart","z":"b779de97.b1b46","group":"fa6f27a81c4d2539","name":"","label":"chart","order":9007199254740991,"chartType":"line","category":"topic","categoryType":"msg","xAxisProperty":"_time","xAxisPropertyType":"msg","xAxisType":"linear","yAxisProperty":"_value","ymin":"","ymax":"","action":"replace","pointShape":"circle","pointRadius":4,"showLegend":true,"removeOlder":"1","removeOlderUnit":"86400","removeOlderPoints":"","colors":["#1f77b4","#aec7e8","#ff7f0e","#2ca02c","#98df8a","#d62728","#ff9896","#9467bd","#c5b0d5"],"width":6,"height":8,"className":"","x":310,"y":4860,"wires":[["a2714c8c86961aad"]]},{"id":"a2714c8c86961aad","type":"debug","z":"b779de97.b1b46","name":"debug 2482","active":true,"tosidebar":true,"console":false,"tostatus":false,"complete":"false","statusVal":"","statusType":"auto","x":490,"y":4860,"wires":[]},{"id":"fa6f27a81c4d2539","type":"ui-group","name":"Tank Status","page":"b74745b3765efdef","width":"6","height":"1","order":-1,"showTitle":true,"className":"","visible":"true","disabled":"false"},{"id":"b74745b3765efdef","type":"ui-page","name":"Tank Status Page","ui":"f2eea23e252f30f6","path":"/page2","icon":"home","layout":"grid","theme":"a965ccfef139317a","order":-1,"className":"","visible":"true","disabled":"false"},{"id":"f2eea23e252f30f6","type":"ui-base","name":"Dolores DB2","path":"/dashboard","includeClientData":true,"acceptsClientConfig":["ui-notification","ui-control"],"showPathInSidebar":false},{"id":"a965ccfef139317a","type":"ui-theme","name":"HN Theme","colors":{"surface":"#5c5c5c","primary":"#00fdff","bgPage":"#383838","groupBg":"#4f4f4f","groupOutline":"#858585"},"sizes":{"pagePadding":"12px","groupGap":"12px","groupBorderRadius":"4px","widgetGap":"12px"}}]

See my example inject with test data, that is all that is required to test not a 620 element array.

After many attempts, I couldn't find out the solution to my problem.
So I used influxdb v1.8 and everything worked fine.
I think that this version is more easy to handle.

Thank you for your time.
Best regards.