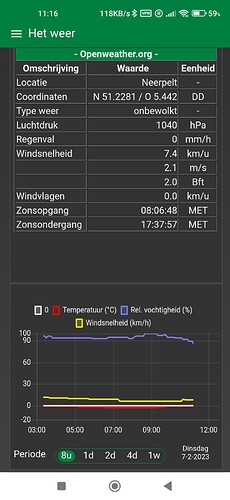
I make use of the chart node for simple real-time trending on my RPI. The data is updated with standard intervals.
So I send a simple payload to the chart node, like this,

Besides the data, I have one extra variable via ui_control.xformat, that is the format for x-axes.
It works well on firefox and edge on my PC. But with chrome or firefox on cellphone the char size of the trend changes by itself after a while (???) as you can see here. The 1 pic shows the trend with changed char size.
After I change the period, so effectively changing ui_control.xformat then char size is normalized again, as shown in second pic.I tried to sneak in a extra char in xformat each time the data is updating, in the hope that it would be seen as an event change, but that didn't work.
Also, the larger I make the trend, the char change is proportionally changed, to ridiculous sizes.
So anyone can help me with this problem?
By the way, I think I have the latest software versions


