I'm getting the data but as separate events, I've inserted the Join node and a function node but still getting only 1 data. I'm guesing my code is wrong in the function node.
Here's what I'm after, I'm looking for all 3 values to come as an array in 1 event so I can show all three points in a graph.
Please create a simple flow using Inject nodes to simulate your inputs, and your Join and Function nodes. Export those nodes and post the flow here using the technique described below. Then we can see what you are doing and suggest improvements.
In order to make code readable and usable it is necessary to surround your code with three backticks (also known as a left quote or backquote ```)
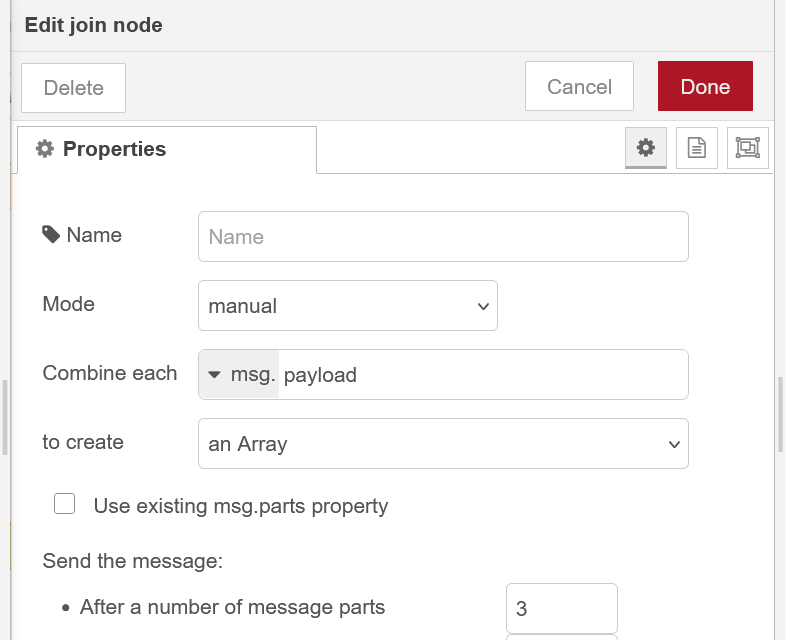
The short answer is yes. You can join three messages into an array using the Join node in manual mode. The best way to do it depends on how you want to use the data. This is a minimal Join setup:
Exactly what sort of graph do you want - eg a line chart or a bar chart?
Should it show how each stdev_[xyz] value changes over time (3 lines on a line chart)? Or a single line joining the three values?
Does the incoming data look exactly like that or have you have translated it into a format that makes more sense to you?
It would be helpful to us if you use a debug node to show the values and share it's output with us.
I think that @Shaun0572 is using the old, now unsupported, dashboard, node-red-dashboard, not the new @flowfuse/node-red-dashboard.
@Shaun0572 there is no need to use a Join at all (if I remember the old dasboard chart correctly). Does the data come from the OPC nodes with the ns=2... string in msg.topic and the value in msg.payload? If so then just feed directly from the OPC nodes to the chart and I think it will work.
If you have only just started with node-red then I suggest you ditch the old node-red-dashboard, which is no longer supported, and start again with new new one @flowfuse/node-red-dashboard
Also, if you have not done so already, then I recommend watching this playlist: Node-RED Essentials. The videos are done by the developers of node-red. They're nice & short and to the point. You will understand a whole lot in about 1 hour. A small investment for a lot of gain.