Good afternoon friends
I would like to make a graph of the network usage of the raspberry pi 4, can anyone tell me if this is possible?
Hi Zike,
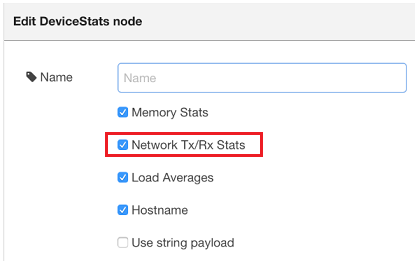
I haven't used it myself, but I assume you could use the node-red-contrib-device-stats node:
Good luck with it!
Bart
Thanks friend. I will try this feature
By the way, I see that there is also the node-red-contrib-linux-network-stats node which is specialized in network traffic, and is very recently updated (which means it is currently maintained well). So that might perhaps be another good choice ...
And if you want to visualize the network traffic in the Node-RED dashboard, you can use the dashboard's core "Chart" node.
There is no example on the readme page of the node-red-contrib-linux-network-stats node, but it is very easy to use. Every time that you inject an input message, it gives you 1 or 2 output messages (depending on what you have selected in the node's config screen):
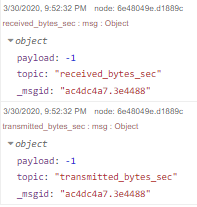
The payload contains the number of bytes (received or sent).
The nice thing is that there are dedicated topics, which means you inject these messages directly into a Chart node to visualize them:
![]()
[{"id":"452d86b1.6d3358","type":"network_stats","z":"8e6e39d1.f0fa58","name":"","receivedBytesSec":true,"transmittedBytesSec":true,"x":480,"y":580,"wires":[["799d2057.7af8d"]]},{"id":"4cc926c.66b23d8","type":"inject","z":"8e6e39d1.f0fa58","name":"","topic":"","payload":"","payloadType":"date","repeat":"1","crontab":"","once":false,"onceDelay":0.1,"x":290,"y":580,"wires":[["452d86b1.6d3358"]]},{"id":"799d2057.7af8d","type":"ui_chart","z":"8e6e39d1.f0fa58","name":"Network traffic","group":"22787703.a0e968","order":3,"width":0,"height":0,"label":"Network traffic","chartType":"line","legend":"true","xformat":"HH:mm:ss","interpolate":"linear","nodata":"","dot":false,"ymin":"","ymax":"","removeOlder":"5","removeOlderPoints":"","removeOlderUnit":"60","cutout":0,"useOneColor":false,"colors":["#1f77b4","#aec7e8","#ff7f0e","#2ca02c","#98df8a","#d62728","#ff9896","#9467bd","#c5b0d5"],"useOldStyle":false,"outputs":1,"x":700,"y":580,"wires":[[]]},{"id":"22787703.a0e968","type":"ui_group","z":"","name":"Web push notifications","tab":"80f0e178.bbf4a","disp":true,"width":"6","collapse":false},{"id":"80f0e178.bbf4a","type":"ui_tab","z":"","name":"Home","icon":"dashboard","order":1,"disabled":false,"hidden":false}]
And then you have it live in your dashboard:

Of course the look-and-feel isn't perfect yet, but then at least you have something to get started ...
@BartButenaers
thank you very much my noble friend. your tip solved exactly what i needed.
big hug (virtual hehe)