I think that it was @Colin who asked those questions, not me!
@jbudd , You're right, I am sorry
No worries.
I stopped using influxdb and grafana on a Raspberry Pi 3B because I found it was too heavy on system resources, can't recall if it was CPU or memory.
But many other people find that they run perfectly well with Node-red on a Pi, so i don't know what the real culprit was.
Like I said until for a week or so I was completely satisfied with performance, besides the memory increment problem that didn't seem to affect the performance.
I think I must have done something small and stupid, but I cannot trace it.
I guess I have to do it the hard way and switch off things to see where the problem might be.
Where was it and how did it get that name? Does that name appear in your flows anywhere?
Were you watching top when you disabled them, in order to see if it made any difference to the cpu spikes?
I would guess that img file may be an image of a complete operating system. Maybe it’s a backup of the sd card itself. ( a typical pi install plus a few extras is about 8gb )
Almost certainly that indicates that you didn't understand how InfluxDB works. You need to keep the limit of data in each table managable otherwise you will get memory issues. Use the auto-trimming to keep detailed data to a managable level. For example, I keep my detailed (1 minute) sensor data for maybe a week or month but also auto-agreggate to hourly data that I keep for several years. InfluxDB is excellent for this.
The high memory use of InfluxDB in the top command you shared indicates that this is almost certainly one of the key reasons for you suddenly getting issues, I once got some thing very similar myself when I had been using InfluxDB on a Pi for a year or 2.
On a Pi, once you start getting short on memory, the use of the SD-Card for SWAP memory indeed often does result also in high CPU (at least on Pi's before v4).
@Colin , I removed that file. It was on the desktop folder. It was from Febr. this year.
Nothing changed in top when I disbaled imaging nodes.
@dceejay . I guess so too. Can't remember though I made this backup there.
@TotallyInformation , @jbudd . Your comments sound very plausible to me. I will investigate this further, I am certainly not an expert at influx so I have to study all the comments you have made about auto-trimming and auto-aggrate. I will concentrate my efforts on this now. Thanks for the advice.
Indeed the virtual memory for influxDB is very high, about 1,29 gb. Wouldn't it solve the problem if I migrate the application to, let say a RPI 4b with 4gb or 8gb? How difficult is it to do this migration? Is there a step-by-step approach somewhere?
I think the tricky bit may be the influx db transfer. You would have to find out how to do that.
If you need to keep the amount of data that you have then I recommend going to a USB disk for the data rather than SD card.
The node red bit should be easy. Install node-red then copy the .node-red folder across from your backup (you do have a backup I am sure). Don't restore the node_modules folder (there is no need to back that up), go into that folder and run
npm install
which will install all the extra nodes you need. Then start (or restart) node-red.
Isn't a migration from raspberry pi 3b to 4b as simple as switching the SD card/SSD over?
That's assuming that the OS is a version released after the 4b was first sold.
There are tools available to migrate from SD to SSD too (look in the RPi forum)
I don't think that really solves it. You will hit the problem again eventually, you would simply be delaying things. Better to get this sorted now. Create a continuous query to agreggate your detailed measurement data into a summary measurement. e.g.
CREATE CONTINUOUS QUERY cq_60min
   ON domotica BEGIN
      SELECT mean(value) AS value, max(value),
             min(value), max(value) - min(value) AS range
      INTO domotica.one_week.env_daily
      FROM domotica.twenty_four_hours.environment
      GROUP BY location, type, time(1h)
   END
and then set a retention policy on the detailed data to only retain a reasonable amount (e.g. a month or a week or whatever). e.g. ALTER RETENTION POLICY "autogen" ON "telegraf" DEFAULT DURATION 768h.
I can't remember whether I even bothered to migrate to be honest, I might not have done. I would think you could probably export the data and then re-import.
Some more details on using InfluxDB here: Need more detailed information on influxdb - General - Node-RED Forum (nodered.org)
I don't believe so because I think the architecture may have changed. Certainly some of the hardware did so it would be much better to create a new SD-Card. That would also mean you could move to the latest Rasbian as well.
@jbudd , @BartButenaers @TotallyInformation @Colin @dceejay
I think the conclusion of my troubles is the excessive use of (virtual)memory cq resources by InfluxDB.
I am gonna sit on this for a while. In the mean time I will monitor closely what happens with memory use and cpu usage. In top the virtual memory use stays stable on 1.29 GB. For the moment it is workable at least, the software updates improved memory usage although cpu usage is still high.

Don't mind the temperature drop, that is caused by leaving the cabinet door opened for some time.
I will keep you informed about progress on this issue.
Did you try my suggestion of stopping influxd to see what effect that has?
@Colin @TotallyInformation @jbudd @dceejay
I kept the system running a view days and I saw the memory stays constant and the cpu usage is slowly increasing overtime.
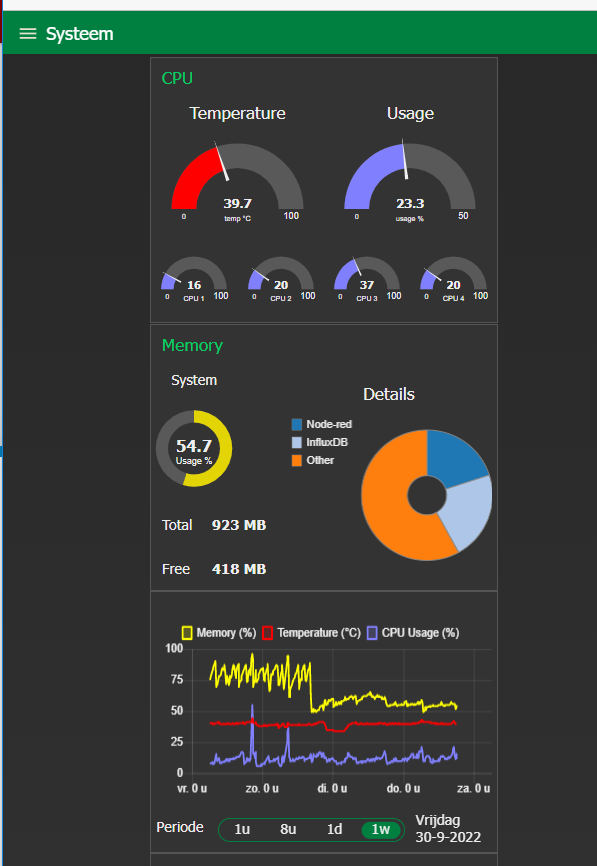
In node I made a system-info flow/page as you could see part of it in my previous post(s). CPU usage and memory usage is based on the nodes from node-red-contrib-cpu/os. I use this page and the info from TOP to analyse my problem with performance.
Today I did some testing. This is what I did and the effect on the system.
Current situation:
Node-red system monitor -> CPU usage 16-28% Mem usage 55-60%
TOP --> Node-red --> 50 -60 %CPU 18 %mem 329 Mb VIRT
----------- InfluxDB --> 0,3 -18 %CPU 27,6 %mem 1.29 Gb VIRT
After restart Node-red:
(5 minutes later)
Node-red system monitor -> CPU usage 17-17% Mem usage 53%
TOP --> Node-red --> 19 -65 %CPU 16 %mem 283 Mb VIRT
----------- InfluxDB --> 0,3 -17 %CPU 16-24.9 %mem 1.29 Gb VIRT
After that I tried disabling all of my flows one by one. I noticed only small drop in cpu usage both in node-red system monitor and TOP, each time that I disabled one.
Then I tried stopping influxDB, this was the result:
sudo service influxdb stop:
Node-red system monitor -> CPU usage 5,5-15% Mem usage 32%
TOP --> Node-red --> 22 -68 %CPU 18,1 %mem 303 Mb VIRT
I cannot draw any conclusions out of these tests, does anyone of you have any ideas?
I prefer htop to top; it shows CPU usage per core and you can click on column headings to sort the output.
I wish I knew how to interpret the multiple processes for each application though. One Node-red process per active message?
Here's my Pi 4 runing Node-red, Mariadb, Zerotier, PiHole, Mosquitto, though there's clearly not much going on just now.


