Node-red, Darksky, data array

Hi, On my project of weather I use Node-Red on Raspberry pi, I have a dashboard with many informations come from sensors, bme280, dht 22, and 18B20 temps sensors. In the same time I take informations from Darksy for forecast, sunrise, sunset, wind direction and forcast on 6 days.

I start to progam them, and I learn some basic thing for programmation in Jscript. But now I hit the wall for extract the data, and use them.

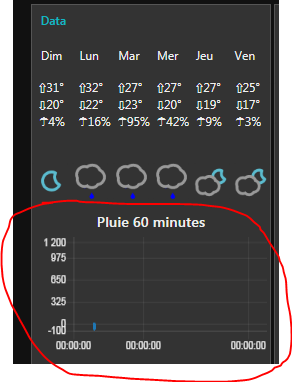
Darksy provide the information of preciprobability, and preciintensity. this data is in a "array" I read many post here, and elseware including w3schools.com (https://www.w3schools.com/js/js_arrays.asp). I try many thing and the extraction are not working, for extract this data and put them in chart for the next 60 minutes.

I joint picture of what I would it look, but for now it's not working.
pourcent%20pluie%203

first : a part of data come from darksky
second : node export and differents test I made for try to use the data "array" for show you, I tried some thing. ( to much caracter for the post, I exede the limit and I delete it, if you want see what I try, tell me and I will post them )
-=-=-=-=-=-=-=-=-=-=-=-=-=-=-==-=-=--=
{"latitude":45.50999832,"longitude":-73.55000305,"timezone":"America/Toronto","currently":{"time":1533423417,"summary":"Partly Cloudy","icon":"partly-cloudy-day","nearestStormDistance":0,"precipIntensity":0.0483,"precipIntensityError":0,"precipProbability":0.01,"precipType":"rain","temperature":26.56,"apparentTemperature":27.76,"dewPoint":19.12,"humidity":0.64,"pressure":1017.24,"windSpeed":0.97,"windGust":3.03,"windBearing":216,"cloudCover":0.44,"uvIndex":0,"visibility":16.09,"ozone":315.21},"minutely":{"summary":"Partly cloudy for the hour.","icon":"partly-cloudy-day","data":[{"time":1533423360,"precipIntensity":0,"precipProbability":0},{"time":1533423420,"precipIntensity":0.0508,"precipIntensityError":0,"precipProbability":0.01,"precipType":"rain"},{"time":1533423480,"precipIntensity":0,"precipProbability":0},{"time":1533423540,"precipIntensity":0.0508,"precipIntensityError":0,"precipProbability":0.02,"precipType":"rain"},{"time":1533423600,"precipIntensity":0.0508,"precipIntensityError":0,"precipProbability":0.01,"precipType":"rain"},{"time":1533423660,"precipIntensity":0,"precipProbability":0},{"time":1533423720,"precipIntensity":0.0508,"precipIntensityError":0,"precipProbability":0.01,"precipType":"rain"},{"time":1533423780,"precipIntensity":0.0508,"precipIntensityError":0,"precipProbability":0.01,"precipType":"rain"},{"time":1533423840,"precipIntensity":0.0508,"precipIntensityError":0,"precipProbability":0.01,"precipType":"rain"},{"time":1533423900,"precipIntensity":0.0508,"precipIntensityError":0,"precipProbability":0.01,"precipType":"rain"},{"time":1533423960,"precipIntensity":0,"precipProbability":0},{"time":1533424020,"precipIntensity":0,"precipProbability":0},{"time":1533424080,"precipIntensity":0.0508,"precipIntensityError":0,"precipProbability":0.01,"precipType":"rain"},{"time":1533424140,"precipIntensity":0,"precipProbability":0},{"time":1533424200,"precipIntensity":0,"precipProbability":0},{"time":1533424260,"precipIntensity":0,"precipProbability":0},{"time":1533424320,"precipIntensity":0,"precipProbability":0},{"time":1533424380,"precipIntensity":0,"precipProbability":0},{"time":1533424440,"precipIntensity":0,"precipProbability":0},{"time":1533424500,"precipIntensity":0,"precipProbability":0},{"time":1533424560,"precipIntensity":0,"precipProbability":0},{"time":1533424620,"precipIntensity":0,"precipProbability":0},{"time":1533424680,"precipIntensity":0,"precipProbability":0},{"time":1533424740,"precipIntensity":0,"precipProbability":0},{"time":1533424800,"precipIntensity":0,"precipProbability":0},{"time":1533424860,"precipIntensity":0,"precipProbability":0},{"time":1533424920,"precipIntensity":0,"precipProbability":0},{"time":1533424980,"precipIntensity":0,"precipProbability":0},{"time":1533425040,"precipIntensity":0,"precipProbability":0},{"time":1533425100,"precipIntensity":0,"precipProbability":0},{"time":1533425160,"precipIntensity":0,"precipProbability":0},{"time":1533425220,"precipIntensity":0,"precipProbability":0},{"time":1533425280,"precipIntensity":0,"precipProbability":0},{"time":1533425340,"precipIntensity":0,"precipProbability":0},{"time":1533425400,"precipIntensity":0,"precipProbability":0},{"time":1533425460,"precipIntensity":0,"precipProbability":0},{"time":1533425520,"precipIntensity":0,"precipProbability":0},{"time":1533425580,"precipIntensity":0,"precipProbability":0},{"time":1533425640,"precipIntensity":0,"precipProbability":0},{"time":1533425700,"precipIntensity":0,"precipProbability":0},{"time":1533425760,"precipIntensity":0,"precipProbability":0},{"time":1533425820,"precipIntensity":0,"precipProbability":0},{"time":1533425880,"precipIntensity":0,"precipProbability":0},{"time":1533425940,"precipIntensity":0,"precipProbability":0},{"time":1533426000,"precipIntensity":0,"precipProbability":0},{"time":1533426060,"precipIntensity":0,"precipProbability":0},{"time":1533426120,"precipIntensity":0,"precipProbability":0},{"time":1533426180,"precipIntensity":0,"precipProbability":0},{"time":1533426240,"precipIntensity":0,"precipProbability":0},{"time":1533426300,"precipIntensity":0,"precipProbability":0},{"time":1533426360,"precipIntensity":0,"precipProbability":0},{"time":1533426420,"precipIntensity":0,"precipProbability":0},{"time":1533426480,"precipIntensity":0,"precipProbability":0},{"time":1533426540,"precipIntensity":0,"precipProbability":0},{"time":1533426600,"precipIntensity":0,"precipProbability":0},{"time":1533426660,"precipIntensity":0,"precipProbability":0},{"time":1533426720,"precipIntensity":0,"precipProbability":0},{"time":1533426780,"precipIntensity":0,"precipProbability":0},{"time":1533426840,"precipIntensity":0,"precipProbability":0},{"time":1533426900,"precipIntensity":0,"precipProbability":0},{"time":1533426960,"precipIntensity":0,"precipProbability":0}]},"hourly":{"summary":"Partly cloudy later this evening.","icon":"partly-cloudy-day","data":[{"time":1533420000,"summary":"Partly Cloudy","icon":"partly-cloudy-day","precipIntensity":0.1626,"precipProbability":0.11,"precipType":"rain","temperature":26.41,"apparentTemperature":27.51,"dewPoint":18.72,"humidity":0.63,"pressure":1017.15,"windSpeed":1.04,"windGust":3.22,"windBearing":216,"cloudCover":0.37,"uvIndex":1,"visibility":16.09,"ozone":313.58},{"time":1533423600,"summary":"Partly Cloudy","icon":"partly-cloudy-day","precip....... (and more)
-=-=-=-=-=-=-=-=-=-=-=-=-=-=-=-=-=-=-=-

If you see my name, is true, I'm not a programmer but I try to learn. I create this post, because I realy need help for continue this part of my project.

if some one want give to me a clue, a direction, or something, I will appreciate and give a following, here.

:slight_smile:

Perhaps the Node-RED shown in this flow could be a start point for you ?

I already have this part in my code, and I translate a few parts in French language, it work well.
I want add the little graphic on the bottom of the forecast, (see image on the red cercle), but I hit the wall for manipulate the type of this data "array"

pourcent%20pluie%204

When I took the data from darksy, I have all information on it, but, I don't have a result when I try to put them on the graph. If you tell me I suppose to find the part of my answer on the node you provide to me, I will digg it :slight_smile:

Feed the output of your DarkSky node into both of these change nodes, you will see how it's done:

[{"id":"998338b6.116868","type":"ui_chart","z":"14cc9fe7.48bf9","name":"","group":"fcd15f04.aceb","order":0,"width":"6","height":"6","label":"","chartType":"line","legend":"false","xformat":"HH:mm","interpolate":"linear","nodata":"","dot":false,"ymin":"-10","ymax":"30","removeOlder":1,"removeOlderPoints":"","removeOlderUnit":"3600","cutout":0,"useOneColor":false,"colors":["#1f77b4","#aec7e8","#ff7f0e","#2ca02c","#98df8a","#d62728","#ff9896","#9467bd","#c5b0d5"],"useOldStyle":false,"x":789.5,"y":229,"wires":[[],[]]},{"id":"f149d209.657f8","type":"change","z":"14cc9fe7.48bf9","name":"","rules":[{"t":"set","p":"payload","pt":"msg","to":"data.currently.temperature","tot":"msg"},{"t":"set","p":"topic","pt":"msg","to":"Temp","tot":"str"}],"action":"","property":"","from":"","to":"","reg":false,"x":601.5,"y":227,"wires":[["998338b6.116868"]]},{"id":"cd97cf24.b721d","type":"change","z":"14cc9fe7.48bf9","name":"","rules":[{"t":"set","p":"payload","pt":"msg","to":"data.currently.apparentTemperature","tot":"msg"},{"t":"set","p":"topic","pt":"msg","to":"Apparent","tot":"str"}],"action":"","property":"","from":"","to":"","reg":false,"x":609,"y":266,"wires":[["998338b6.116868"]]},{"id":"fcd15f04.aceb","type":"ui_group","z":"","name":"Temperature","tab":"23f0ce91.a4c562","order":1,"disp":true,"width":"6"},{"id":"23f0ce91.a4c562","type":"ui_tab","z":"","name":"Weather","icon":"dashboard","order":5}]

I am triggering the DarkSky node every 5 minutes.

I suppose you want to display, in the dashboard chart, the hourly data for rain, is that correct ?

The data from darksky will be something like below .

What is the property you want to extract and display exactly ? Perhaps precipIntensity ?

{
  "hourly": {
    "summary": "Rain starting later this afternoon, continuing until this evening.",
    "icon": "rain",
    "data": [
      {
        "time": 1509991200,
        "summary": "Mostly Cloudy",
        "icon": "partly-cloudy-day",
        "precipIntensity": 0.0007,
        "precipProbability": 0.1,
        "precipType": "rain",
        "temperature": 65.76,
        "apparentTemperature": 66.01,
        "dewPoint": 60.99,
        "humidity": 0.85,
        "pressure": 1010.57,
        "windSpeed": 4.23,
        "windGust": 9.52,
        "windBearing": 230,
        "cloudCover": 0.62,
        "uvIndex": 1,
        "visibility": 9.32,
        "ozone": 268.95
      }, ... more objects like the previous one...

Hi, Gentlemen !
@ghayne : I try what you gave to me, I have a page for the chart Temperature, but I have nothing at the output (on the chart) . The chart was empty

@Andrei : your'e right, is for put on chart, data rain for "preciProbability".

I Know this kind of data is a array, but after read many thing about that, my knolage are not well.
The kind of data I would look like after process them is around that :
pourcent%20pluie%202
OR that :
pourcent%20pluie%205
note : the graphic are made with visio

Here few try I made for process the data, but nothing work, all the data come from darksky (please don't laugh to hard )
-=-=-=-=-=-=-=-=-=-=-=-=-=-=-=-
[{"id":"7927de66.d9ff1","type":"function","z":"d546b722.81cce8","name":"Untitled Theme 1","func":"\nvar donnees = msg.payload\ndonnees = data : [ time : [ ], precipIntensity : [ ], precipProbability : [ ] ] ;\nreturn msg; \n\n/\nvar myVars = msg.payload.split("time");\nvar result = {};\nmyVars.forEach(function(v) {\n // The following split uses ' = ' - because your example output appears to\n // have spaces around the equals sign.\n var parts = v.split(" = ");\n result[parts[0]] = parts[1];\n});\nmsg.payload = result;\n// The Function node returns the message to be sent to the next node(s) in the flow\nreturn msg;\n/\n/\n //fonctionnel sort batch array :frowning: \nvar outputMsgs =[];\nvar myVars = msg.payload.data;\nfor (var w in myVars ){\n outputMsgs.push({payload:myVars[w]});\n}\noutputMsgs.shift();\nreturn [outputMsgs ];\n/\n/\nvar msg = {\n \n [1] : msg.payload.minutely.data[precipIntensity],\n [2] : msg.payload.minutely.data.time,\n [3] : data.time.preciProbability,\n } \nnode.status({text:msg});\nreturn msg;\n/\n/\nvar etime = msg.payload.time\nvar edate = (Date (etime * 1000));\ncontext.global.moment = edate\nnode.status({text:msg})\nreturn {payload:context.global.moment};\n/\n//precipProbability":0}\n\n\n/\n//heure fonctionnel - pris des prévisions\nvar sec = msg.payload.epoch; \nvar date = Date (sec * 1000);\ncontext.global.moment = date;\n node.status({text:context.global.moment});\nreturn {payload:context.global.moment};\n// status du node : node.status({text:msg.payload.winddirection});\n// exemple autre node : return {payload:context.global.outdoor_temp};\n/","outputs":1,"noerr":0,"x":670.0001411437988,"y":399.8890857696533,"wires":[["b60b0f0b.97668"]]},{"id":"b60b0f0b.97668","type":"debug","z":"d546b722.81cce8","name":"Test","active":true,"console":"false","complete":"payload","x":834.0001068115234,"y":365.889084815979,"wires":[]}]
-=-=-=-=-=-=-=-=-=-=-=-=-

All right badprogramer,

Please try flow below. I do not have access to the API server so I tested with some fake data. It will not work if I did some wrong assumption. You should connect the data retrieved from darksky to the change node named "precipIntensity" (the one more to the left in the flow).

[{"id":"9733d50.6038428","type":"tab","label":"Flow 3","disabled":false,"info":""},{"id":"616c3a9b.21f244","type":"debug","z":"9733d50.6038428","name":"","active":true,"tosidebar":true,"console":false,"tostatus":false,"complete":"true","x":510,"y":260,"wires":[]},{"id":"dbb611b9.3adea","type":"ui_chart","z":"9733d50.6038428","name":"","group":"c22b50e5.35a44","order":0,"width":0,"height":0,"label":"{{msg.label}}","chartType":"line","legend":"true","xformat":"auto","interpolate":"linear","nodata":"","dot":false,"ymin":"","ymax":"","removeOlder":1,"removeOlderPoints":"","removeOlderUnit":"3600","cutout":0,"useOneColor":false,"colors":["#1f77b4","#aec7e8","#ff7f0e","#2ca02c","#98df8a","#d62728","#ff9896","#9467bd","#c5b0d5"],"useOldStyle":false,"x":870,"y":220,"wires":[[],[]]},{"id":"7b26d4ea.64ee2c","type":"inject","z":"9733d50.6038428","name":"","topic":"","payload":"[]","payloadType":"json","repeat":"","crontab":"","once":false,"onceDelay":0.1,"x":750,"y":280,"wires":[["dbb611b9.3adea"]]},{"id":"a97774cf.ae9cf8","type":"change","z":"9733d50.6038428","name":"precipIntensity","rules":[{"t":"set","p":"payload.data1","pt":"msg","to":"msg.payload.hourly.data.{\"x\":time,\"y\":precipIntensity*100000}","tot":"jsonata"}],"action":"","property":"","from":"","to":"","reg":false,"x":340,"y":220,"wires":[["616c3a9b.21f244","76e684bd.1c317c"]]},{"id":"76e684bd.1c317c","type":"function","z":"9733d50.6038428","name":"Setup payload","func":"series = [];\ndata = [];\nlabels = [];\n\nseries.push(\"precipIntensity\");\ndata.push(msg.payload.data1);\nlabels.push(\"precipIntensity\");\n\nmsg.payload = [{\"series\":series, \"data\":data,\"labels\": labels}];\n\nreturn msg;","outputs":1,"noerr":0,"x":660,"y":220,"wires":[["dbb611b9.3adea"]]},{"id":"c22b50e5.35a44","type":"ui_group","z":"","name":"Group 1","tab":"44961e53.9365d","disp":true,"width":"6","collapse":false},{"id":"44961e53.9365d","type":"ui_tab","z":"","name":"Tab1","icon":"dashboard"}]

I use the node you gave to me. I try them, and I have this result:
group%201
I have a data on the graph
now, i tryed to modify the function of the graph with the data come from darksy.
value come from darksky - data Darksky-11.txt (29.8 KB), this is the data take from debug node and past on notepad ++.

and this : value precipintensity - msg - 22.txt (31.2 KB) is the output from precipintensity node with darrksy data.

when I try to modify something on the function setup payload, I have reference error :frowning:

I will continue to experiment how to extract the data for put them on the chart.

Cheers!

Hi badprogramer, this is good.

As it is working let me explain how you can modify the flow but before let me warn you that the flow I shared before displays the value of precipIntensity multiplied by 100.000, as the values were very small to fit nicely in the chart.

The main part of the flow is the jsonata expression in the change node. This expression will filter and transform the interesting data (to be displayed).

When you open the config dialog for the change node you can change this jsonata expression. Lets change precipIntensity to precipProbability. First changing the change node config.

Second changing the function node (only two lines need to be changed):

See the end result:

r-003

Let me know if you want to change something else or if something is not clear for you.

I changed one thing in the change node : msg.payload.hourly.data.{"x":time, "y":precipIntensity100} for msg.payload.minutely.data.{"x":time, "y":precipIntensity100}.

now the prediction is no rain for the rest of the day, the chart indicate now 0, it's normal.

But when I check the time, it's never change, alway same time on the X axis. I know is the epoch time taked from the node, if you have a time and just give to me some explication , is not clear for me why the time not move. :slight_smile:

-=-=-=-=-=-=- this is the nodes -=-=-=-=-=-=-=-=--=
[{"id":"70909f24.f3c12","type":"ui_chart","z":"8ea2da51.7e18f8","name":"","group":"933fb2d5.0cb13","order":2,"width":0,"height":0,"label":"{{msg.label}}","chartType":"line","legend":"true","xformat":"HH:mm:ss","interpolate":"linear","nodata":"","dot":false,"ymin":"","ymax":"","removeOlder":1,"removeOlderPoints":"","removeOlderUnit":"3600","cutout":0,"useOneColor":false,"colors":["#1f77b4","#aec7e8","#ff7f0e","#2ca02c","#98df8a","#d62728","#ff9896","#9467bd","#c5b0d5"],"useOldStyle":false,"x":1005.0000343322754,"y":392.0000514984131,"wires":[["1d42dcdf.1dc513"],["1e51ce66.764cc2"]]},{"id":"ee4353cc.236ce","type":"debug","z":"8ea2da51.7e18f8","name":"data Darksky-11","active":false,"tosidebar":true,"console":false,"tostatus":false,"complete":"true","x":346.0000877380371,"y":452.0000944137573,"wires":},{"id":"15dcc05b.700bf","type":"inject","z":"8ea2da51.7e18f8","name":"a la demande","topic":"","payload":"","payloadType":"date","repeat":"","crontab":"","once":false,"x":242.00000381469727,"y":241.8890209197998,"wires":[["57c91c1a.fbae34"]]},{"id":"1d42dcdf.1dc513","type":"debug","z":"8ea2da51.7e18f8","name":"33","active":true,"tosidebar":true,"console":false,"tostatus":false,"complete":"payload","x":1143.0002746582031,"y":350.0000524520874,"wires":},{"id":"1e51ce66.764cc2","type":"debug","z":"8ea2da51.7e18f8","name":"44","active":true,"tosidebar":true,"console":false,"tostatus":false,"complete":"payload","x":1139.0002784729004,"y":438.0001754760742,"wires":},{"id":"a845bc.005aca48","type":"debug","z":"8ea2da51.7e18f8","name":"","active":true,"tosidebar":true,"console":false,"tostatus":false,"complete":"true","x":619.0000152587891,"y":314.00000953674316,"wires":},{"id":"bb5bc6d2.f1caa8","type":"ui_chart","z":"8ea2da51.7e18f8","name":"","group":"933fb2d5.0cb13","order":1,"width":0,"height":0,"label":"{{msg.label}}","chartType":"line","legend":"true","xformat":"auto","interpolate":"linear","nodata":"","dot":false,"ymin":"","ymax":"","removeOlder":1,"removeOlderPoints":"","removeOlderUnit":"3600","cutout":0,"useOneColor":false,"colors":["#1f77b4","#aec7e8","#ff7f0e","#2ca02c","#98df8a","#d62728","#ff9896","#9467bd","#c5b0d5"],"useOldStyle":false,"x":997.0000267028809,"y":259.00004863739014,"wires":[,]},{"id":"4988bb24.f6cfa4","type":"inject","z":"8ea2da51.7e18f8","name":"","topic":"","payload":"","payloadType":"json","repeat":"","crontab":"","once":false,"onceDelay":0.1,"x":843.0000228881836,"y":305.00000953674316,"wires":[["bb5bc6d2.f1caa8"]]},{"id":"eb6f6470.0a3028","type":"change","z":"8ea2da51.7e18f8","name":"precipIntensity","rules":[{"t":"set","p":"payload.data1","pt":"msg","to":"msg.payload.minutely.data.{"x":time, "y":precipIntensity100}","tot":"jsonata"}],"action":"","property":"","from":"","to":"","reg":false,"x":519.0000915527344,"y":258.0000476837158,"wires":[["a845bc.005aca48","60554d7f.d2c594"]]},{"id":"60554d7f.d2c594","type":"function","z":"8ea2da51.7e18f8","name":"Setup payload","func":"series = [];\ndata = [];\nlabels = [];\ntime = [];\n\ntime.push("time")\nseries.push("precipIntensity");\ndata.push(msg.payload.data1);\nlabels.push("precipIntensity");\n\nmsg.payload = [{"series":series, "time":time, "data":data,"labels": labels}];\n\nreturn msg;","outputs":1,"noerr":0,"x":753.0000228881836,"y":260.0000286102295,"wires":[["bb5bc6d2.f1caa8"]]},{"id":"574a5f66.c9627","type":"debug","z":"8ea2da51.7e18f8","name":"","active":true,"tosidebar":true,"console":false,"tostatus":false,"complete":"true","x":631.0000171661377,"y":450.00001335144043,"wires":[]},{"id":"cca43f50.7b45b","type":"inject","z":"8ea2da51.7e18f8","name":"","topic":"","payload":"[]","payloadType":"json","repeat":"","crontab":"","once":false,"onceDelay":0.1,"x":851.0000267028809,"y":452.0000114440918,"wires":[["70909f24.f3c12"]]},{"id":"1093e231.54ca2e","type":"change","z":"8ea2da51.7e18f8","name":"precipProbability","rules":[{"t":"set","p":"payload.data1","pt":"msg","to":"msg.payload.minutely.data.{"x":time, "y":precipProbability100}","tot":"jsonata"}],"action":"","property":"","from":"","to":"","reg":false,"x":523.0000534057617,"y":396.0000514984131,"wires":[["574a5f66.c9627","2b2075bb.f6704a"]]},{"id":"2b2075bb.f6704a","type":"function","z":"8ea2da51.7e18f8","name":"Setup payload","func":"series = ;\ndata = ;\nlabels = ;\n\nseries.push("precipProbability");\ndata.push(msg.payload.data1);\nlabels.push("precipProbability");\n\nmsg.payload = [{"series":series, "data":data,"labels": labels}];\n\nreturn msg;","outputs":1,"noerr":0,"x":773.0000076293945,"y":395.00001335144043,"wires":[["70909f24.f3c12"]]},{"id":"57c91c1a.fbae34","type":"http request","z":"8ea2da51.7e18f8","name":"GET Darksky JSON P","method":"GET","ret":"obj","url":"https://api.darksky.net/forecast/YOUR KEY/45.50999832,-73.55000305?units=si","tls":"","x":306,"y":334.0000171661377,"wires":[["eb6f6470.0a3028","1093e231.54ca2e","ee4353cc.236ce"]]},{"id":"933fb2d5.0cb13","type":"ui_group","z":"","name":"Group 1","tab":"2955c9c4.5f1396","disp":true,"width":"18","collapse":false},{"id":"2955c9c4.5f1396","type":"ui_tab","z":"","name":"Tab1","icon":"dashboard"}]
=-=-=-=-=-=-=-=-=-

mmm... in such case I believe it is necessary to multiply time by 1000 since Javascript datastamp are in miliseconds whereas the time coming from darkside must be in seconds.

Using the dataset your provided the minutely data will display 60 measurements in the range of one hour.

r-002

Hi Andrei,
yes, for the epoch time, when you X 1000 you have the good local time.
I appreciate the time you gave to me, and to us (all the people watch this post)
You found the answer to my questions. with the answer I just use what you gave and more, I try do decode, how you resolve my questions and I learn :smile:

with the code, I use more data than I think, In the same time I use the "precipIntensity" hourly and minutely and the "precipProbability" in hourly and minutely. and put the result on the graph.

I joint the nodes
-=-=-=-=-=-=-=-=-=-=-=-=-
[{"id":"70909f24.f3c12","type":"ui_chart","z":"8ea2da51.7e18f8","name":"Probabilité M","group":"933fb2d5.0cb13","order":1,"width":"12","height":"6","label":"{{msg.label}}","chartType":"line","legend":"true","xformat":"HH:mm","interpolate":"linear","nodata":"","dot":false,"ymin":"0","ymax":"100","removeOlder":"2","removeOlderPoints":"","removeOlderUnit":"3600","cutout":0,"useOneColor":false,"colors":["#1f77b4","#aec7e8","#ff7f0e","#2ca02c","#98df8a","#d62728","#ff9896","#9467bd","#c5b0d5"],"useOldStyle":false,"x":1025.0001163482666,"y":359.00013160705566,"wires":[,]},{"id":"15dcc05b.700bf","type":"inject","z":"8ea2da51.7e18f8","name":"a la demande","topic":"","payload":"","payloadType":"date","repeat":"1800","crontab":"","once":false,"onceDelay":"","x":242.00000381469727,"y":238.88902473449707,"wires":[["17a9f85b.741568"]]},{"id":"a845bc.005aca48","type":"debug","z":"8ea2da51.7e18f8","name":"","active":false,"tosidebar":true,"console":false,"tostatus":false,"complete":"true","x":627.0000190734863,"y":221.00002765655518,"wires":},{"id":"bb5bc6d2.f1caa8","type":"ui_chart","z":"8ea2da51.7e18f8","name":"Intensité M","group":"933fb2d5.0cb13","order":4,"width":"12","height":"6","label":"{{msg.label}}","chartType":"line","legend":"true","xformat":"auto","interpolate":"linear","nodata":"","dot":false,"ymin":"0","ymax":"250","removeOlder":"2","removeOlderPoints":"","removeOlderUnit":"3600","cutout":0,"useOneColor":false,"colors":["#1f77b4","#aec7e8","#ff7f0e","#2ca02c","#98df8a","#d62728","#ff9896","#9467bd","#c5b0d5"],"useOldStyle":false,"x":1018.0000267028809,"y":267.0000696182251,"wires":[,]},{"id":"eb6f6470.0a3028","type":"change","z":"8ea2da51.7e18f8","name":"precipIntensity","rules":[{"t":"set","p":"payload.data1","pt":"msg","to":"msg.payload.minutely.data.{"x":time1000, "y":precipIntensity100}","tot":"jsonata"}],"action":"","property":"","from":"","to":"","reg":false,"x":520.0000915527344,"y":266.0000686645508,"wires":[["a845bc.005aca48","60554d7f.d2c594"]]},{"id":"60554d7f.d2c594","type":"function","z":"8ea2da51.7e18f8","name":"Setup payload","func":"series = ;\ndata = ;\nlabels = ;\ntime = ;\n\ntime.push("time")\nseries.push("precipIntensity");\ndata.push(msg.payload.data1);\nlabels.push("precipIntensity");\n\nmsg.payload = [{"series":series, "time":time, "data":data,"labels": labels}];\n\nreturn msg;","outputs":1,"noerr":0,"x":754.0000228881836,"y":268.00004959106445,"wires":[["bb5bc6d2.f1caa8"]]},{"id":"574a5f66.c9627","type":"debug","z":"8ea2da51.7e18f8","name":"","active":false,"tosidebar":true,"console":false,"tostatus":false,"complete":"true","x":622.0001411437988,"y":398.000093460083,"wires":},{"id":"cca43f50.7b45b","type":"inject","z":"8ea2da51.7e18f8","name":"","topic":"","payload":"","payloadType":"json","repeat":"","crontab":"","once":false,"onceDelay":0.1,"x":849.000186920166,"y":418.000093460083,"wires":[["70909f24.f3c12","9d20c0c8.87af6"]]},{"id":"1093e231.54ca2e","type":"change","z":"8ea2da51.7e18f8","name":"precipProbability","rules":[{"t":"set","p":"payload.data1","pt":"msg","to":"msg.payload.minutely.data.{"x":time1000, "y":precipProbability100}","tot":"jsonata"}],"action":"","property":"","from":"","to":"","reg":false,"x":523.0001354217529,"y":363.00013160705566,"wires":[["574a5f66.c9627","2b2075bb.f6704a"]]},{"id":"2b2075bb.f6704a","type":"function","z":"8ea2da51.7e18f8","name":"Setup payload","func":"series = ;\ndata = ;\nlabels = ;\n\nseries.push("precipProbability");\ndata.push(msg.payload.data1);\nlabels.push("precipProbability");\n\nmsg.payload = [{"series":series, "data":data,"labels": labels}];\n\nreturn msg;","outputs":1,"noerr":0,"x":773.0000896453857,"y":362.000093460083,"wires":[["70909f24.f3c12"]]},{"id":"95646842.7525a8","type":"debug","z":"8ea2da51.7e18f8","name":"","active":false,"tosidebar":true,"console":false,"tostatus":false,"complete":"true","x":626.0000152587891,"y":185.0000057220459,"wires":},{"id":"fc121fba.e72d8","type":"ui_chart","z":"8ea2da51.7e18f8","name":"Intensité H","group":"933fb2d5.0cb13","order":3,"width":"12","height":"6","label":"{{msg.label}}","chartType":"line","legend":"true","xformat":"auto","interpolate":"linear","nodata":"","dot":false,"ymin":"0","ymax":"250","removeOlder":"1","removeOlderPoints":"","removeOlderUnit":"3600","cutout":0,"useOneColor":false,"colors":["#1f77b4","#aec7e8","#ff7f0e","#2ca02c","#98df8a","#d62728","#ff9896","#9467bd","#c5b0d5"],"useOldStyle":false,"x":1017.0000114440918,"y":146.00003910064697,"wires":[,]},{"id":"69e58bfb.dc5cb4","type":"inject","z":"8ea2da51.7e18f8","name":"","topic":"","payload":"","payloadType":"json","repeat":"","crontab":"","once":false,"onceDelay":0.1,"x":844.0000228881836,"y":208.0000057220459,"wires":[["fc121fba.e72d8","bb5bc6d2.f1caa8"]]},{"id":"40612c94.271f84","type":"change","z":"8ea2da51.7e18f8","name":"precipIntensity H","rules":[{"t":"set","p":"payload.data1","pt":"msg","to":"msg.payload.hourly.data.{"x":time1000, "y":precipIntensity100}","tot":"jsonata"}],"action":"","property":"","from":"","to":"","reg":false,"x":536.0000762939453,"y":145.00003814697266,"wires":[["95646842.7525a8","28004a9.3d61bb6"]]},{"id":"28004a9.3d61bb6","type":"function","z":"8ea2da51.7e18f8","name":"Setup payload","func":"series = ;\ndata = ;\nlabels = ;\ntime = ;\n\ntime.push("time")\nseries.push("precipIntensity");\ndata.push(msg.payload.data1);\nlabels.push("precipIntensity");\n\nmsg.payload = [{"series":series, "time":time, "data":data,"labels": labels}];\n\nreturn msg;","outputs":1,"noerr":0,"x":760.0000076293945,"y":147.00001907348633,"wires":[["fc121fba.e72d8"]]},{"id":"9d20c0c8.87af6","type":"ui_chart","z":"8ea2da51.7e18f8","name":"Probabilité H","group":"933fb2d5.0cb13","order":2,"width":"12","height":"6","label":"{{msg.label}}","chartType":"line","legend":"true","xformat":"HH:mm","interpolate":"linear","nodata":"","dot":false,"ymin":"0","ymax":"100","removeOlder":"2","removeOlderPoints":"","removeOlderUnit":"3600","cutout":0,"useOneColor":false,"colors":["#1f77b4","#aec7e8","#ff7f0e","#2ca02c","#98df8a","#d62728","#ff9896","#9467bd","#c5b0d5"],"useOldStyle":false,"x":1025.0001106262207,"y":478.00009536743164,"wires":[,]},{"id":"974627ec.34ced8","type":"debug","z":"8ea2da51.7e18f8","name":"","active":false,"tosidebar":true,"console":false,"tostatus":false,"complete":"true","x":622.0001411437988,"y":434.00005435943604,"wires":},{"id":"dd6cf1e5.07b02","type":"change","z":"8ea2da51.7e18f8","name":"precipProbability H","rules":[{"t":"set","p":"payload.data1","pt":"msg","to":"msg.payload.hourly.data.{"x":time1000, "y":precipProbability100}","tot":"jsonata"}],"action":"","property":"","from":"","to":"","reg":false,"x":538.0000915527344,"y":479.00009632110596,"wires":[["974627ec.34ced8","9d86403b.24989"]]},{"id":"9d86403b.24989","type":"function","z":"8ea2da51.7e18f8","name":"Setup payload","func":"series = ;\ndata = ;\nlabels = ;\n\nseries.push("precipProbability");\ndata.push(msg.payload.data1);\nlabels.push("precipProbability");\n\nmsg.payload = [{"series":series, "data":data,"labels": labels}];\n\nreturn msg;","outputs":1,"noerr":0,"x":778.0000457763672,"y":478.0000581741333,"wires":[["9d20c0c8.87af6"]]},{"id":"17a9f85b.741568","type":"http request","z":"8ea2da51.7e18f8","name":"GET Darksky JSON","method":"GET","ret":"obj","url":"https://api.darksky.net/forecast/YOUR KEY/45.50999832,-73.55000305?units=si","tls":"","x":298,"y":328.00001525878906,"wires":[["40612c94.271f84","eb6f6470.0a3028","1093e231.54ca2e","dd6cf1e5.07b02"]]},{"id":"bda2bf20.dfe15","type":"comment","z":"8ea2da51.7e18f8","name":"comment","info":"you need to insert your key on the node","x":258.1666946411133,"y":364.0000114440918,"wires":},{"id":"933fb2d5.0cb13","type":"ui_group","z":"","name":"Group 1","tab":"2955c9c4.5f1396","disp":true,"width":"18","collapse":false},{"id":"2955c9c4.5f1396","type":"ui_tab","z":"","name":"Tab1","icon":"dashboard"}]
-=-=-=-=-=-=-=-=-=-=-=-=

1 Like

I know this is a little late but I've just been looking to refresh my weather processing.

The following JSONata expression works without the need for a separate function node:

[{
    "series": ["Intensity","Probability"],
    "data": [ [ payload.hourly.data.{"x":time*1000,"y":precipIntensity} ],
    [ payload.hourly.data.{"x":time*1000,"y":precipProbability} ] ],
    "labels": []
}]

I've also included a second output on the same chart though it doesn't work that well without a 2nd Y axis which isn't currently possible with the Dashboard Chart node.

Also note that DarkSky returns UNIX timestamps. You have to multiply them by 1000 to use in JavaScript.

Finally note that the intensity is in inches per hr (US) or mm per hour (everywhere else). Not sure if this has changed since this thread.

Darksky have been working on a new version of the API which will entirely replace the existing one. They are expecting to release it in 2 months time.
...just when I've also refreshed my weather flow....

1 Like

Doh! Well, I'll maybe delay - again! Been putting it off but I need to get the external temperature and humidity to improve the heating controls.

Of course, I should really be building a new sensor so I can move one outside to get local readings. So maybe that's what I need to focus on for now.

I'm also trying out the Accuweather API though it isn't clear whether there is really a free allocation for it. Unlike DarkSky, they only talk about a "trial".