I am getting data for every 1 minutes, but how I couldn’t activate the RTC.

So my X-axis on the dashboard looking like this, I would like to have time on my X-axis here based on my PC (Real-Time Clock)
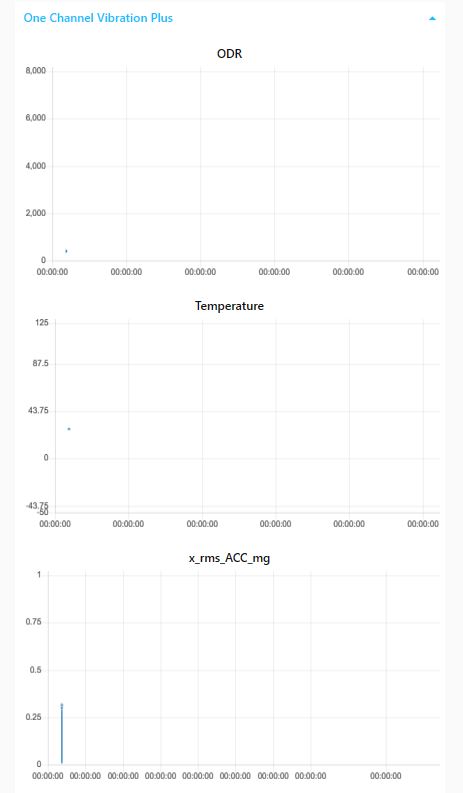
How do I resolve this?
Show us the some of the messages that you are sending to the chart node, and how you have configured the chart node. It should default to showing the system time on the x axis
may I know where is the chart node?
I don't understand what you mean. It is one of the node red dashboard nodes. How are you displaying charts at the moment?
Those are Chart nodes, as far as I can see. So I don't understand what you mean by 'where is the chart node`.
Feed the messages you are sending to one of those into a debug node and show us what you see. Also double click the Chart node and show us how it is configured. How often are you sending the chart messages?
This is my flow
type 80.txt (4.9 KB)
I don't need the flow, and if I did it would only be a very few nodes, not a large amount.
You must send just simple values to the chart node, in msg.payload. Not a complete object. So if you wanted to chart the temperature, then use a Change node to Move msg.payload.temperature To msg.payload and feed that to the chart.
Is it possible for you to guide me with pictures on what to fix?
To make it easier to help you, please select (CTRL click) the nodes I have ringed, Export, Selected Nodes, Copy to clipboard. Then in the forum click the </> button and paste.
Also show us the output from this node. Not a screenshot, click the Copy value button in the Debug pane. As above paste the results in here

[{"id":"8d250064.81de5","type":"ncd-wireless-node","z":"e28e4acf.7027d8","name":"Vibration Sensor ","connection":"837142ce.132b28","config_comm":"837142ce.132b28","addr":"00:13:a2:00:41:dc:a6:cf","sensor_type":"80","auto_config":true,"node_id_delay_active":true,"node_id":"0","delay":"1","destination":"0000FFFF","power_active":true,"power":"4","retries_active":false,"retries":10,"pan_id":"7FFF","change_enabled":"","change_pr":"0","change_interval":"0","cm_calibration":"60.6","bp_altitude":"0","bp_pressure":"0","bp_temp_prec":"0","bp_press_prec":"0","amgt_accel":"0","amgt_mag":"0","amgt_gyro":"0","impact_accel":"0","impact_data_rate":"4","impact_threshold":25,"impact_duration":1,"activ_interr_x":1,"activ_interr_y":2,"activ_interr_z":4,"activ_interr_op":8,"force_calibration_co2_auto_config":"","force_calibration_co2":400,"filtering":0,"data_rate":5,"time_series":0,"reading_type":1,"mode_80_active":true,"mode_80":"0","filter_80_active":true,"filter_80":"1","output_data_rate_101_active":true,"output_data_rate_101":"9","sampling_duration_101_active":true,"sampling_duration_101":"1","sampling_interval_101_active":false,"sampling_interval_101":"0","full_scale_range_101_active":"","full_scale_range_101":1,"x_axis_101":false,"y_axis_101":"","z_axis_101":"","x":300,"y":420,"wires":[["4651e0a3.f4aea","9ae96b41.a24a78"]]},{"id":"4651e0a3.f4aea","type":"split","z":"e28e4acf.7027d8","name":"","splt":"\\n","spltType":"str","arraySplt":1,"arraySpltType":"len","stream":false,"addname":"topic","x":690,"y":520,"wires":[["1ffa63a9.fdd31c"]]},{"id":"1ffa63a9.fdd31c","type":"switch","z":"e28e4acf.7027d8","name":"1 Vibration Plus","property":"topic","propertyType":"msg","rules":[{"t":"eq","v":"odr","vt":"str"},{"t":"eq","v":"temperature","vt":"str"},{"t":"eq","v":"x_rms_ACC_G","vt":"str"},{"t":"eq","v":"x_max_ACC_G","vt":"str"},{"t":"eq","v":"x_velocity_mm_sec","vt":"str"},{"t":"eq","v":"x_displacement_mm","vt":"str"},{"t":"eq","v":"x_peak_one_Hz","vt":"str"},{"t":"eq","v":"x_peak_two_Hz","vt":"str"},{"t":"eq","v":"x_peak_three_Hz","vt":"str"},{"t":"eq","v":"y_rms_ACC_G","vt":"str"},{"t":"eq","v":"y_max_ACC_G","vt":"str"},{"t":"eq","v":"y_velocity_mm_sec","vt":"str"},{"t":"eq","v":"y_displacement_mm","vt":"str"},{"t":"eq","v":"y_peak_one_Hz","vt":"str"},{"t":"eq","v":"y_peak_two_Hz","vt":"str"},{"t":"eq","v":"y_peak_three_Hz","vt":"str"},{"t":"eq","v":"z_rms_ACC_G","vt":"str"},{"t":"eq","v":"z_max_ACC_G","vt":"str"},{"t":"eq","v":"z_velocity_mm_sec","vt":"str"},{"t":"eq","v":"z_displacement_mm","vt":"str"},{"t":"eq","v":"z_peak_one_Hz","vt":"str"},{"t":"eq","v":"z_peak_two_Hz","vt":"str"},{"t":"eq","v":"z_peak_three_Hz","vt":"str"}],"checkall":"true","repair":false,"outputs":23,"x":960,"y":540,"wires":[["cd8d3328.7facb"],["b1507b3.b967688"],["beeee0f1.2e7f6"],["f4afcc82.b4325"],["d3f0ed33.8fd7c"],["13c8706a.1abc1"],["307005e1.61813a"],["d05b67e3.edcb88"],["33ec7c38.2dc4a4"],["a4622e90.0626e"],["2eb152b.c72ddae"],["d1417aef.bee298"],["d70c3e09.75641"],["ba4e5778.4bd2b8"],["6b01820d.1cba5c"],["994e3290.69d08"],["e65c3a28.418b28"],["3a8e0e8b.fde4f2"],["df45e007.502fa"],["aba0749d.2c3108"],["2480c2a1.a657fe"],["8fda8402.6510b8"],["675b5198.9b2a1"]]},{"id":"b1507b3.b967688","type":"ui_chart","z":"e28e4acf.7027d8","name":"","group":"ecb850fe.21321","order":2,"width":0,"height":0,"label":"Temperature","chartType":"line","legend":"false","xformat":"HH:mm:ss","interpolate":"linear","nodata":"","dot":true,"ymin":"-50","ymax":"125","removeOlder":1,"removeOlderPoints":"","removeOlderUnit":"3600","cutout":0,"useOneColor":false,"useUTC":false,"colors":["#1f77b4","#aec7e8","#ff7f0e","#2ca02c","#98df8a","#d62728","#ff9896","#9467bd","#c5b0d5"],"outputs":1,"useDifferentColor":false,"x":1450,"y":360,"wires":[[]]},{"id":"307005e1.61813a","type":"ui_chart","z":"e28e4acf.7027d8","name":"","group":"ecb850fe.21321","order":7,"width":0,"height":0,"label":"X Freq band one","chartType":"line","legend":"false","xformat":"HH:mm:ss","interpolate":"linear","nodata":"","dot":true,"ymin":"0","ymax":"2000","removeOlder":1,"removeOlderPoints":"","removeOlderUnit":"86400","cutout":0,"useOneColor":false,"useUTC":false,"colors":["#1f77b4","#aec7e8","#ff7f0e","#2ca02c","#98df8a","#d62728","#ff9896","#9467bd","#c5b0d5"],"outputs":1,"useDifferentColor":false,"x":1470,"y":580,"wires":[[]]},{"id":"837142ce.132b28","type":"ncd-gateway-config","z":"","name":"","comm_type":"serial","ip_address":"","tcp_port":"2101","port":"/dev/ttyS1","baudRate":"115200","pan_id":"7FFF","rssi":false},{"id":"ecb850fe.21321","type":"ui_group","name":"One Channel Vibration Plus","tab":"e07a3ec3.1021c","order":6,"disp":true,"width":"12","collapse":true},{"id":"e07a3ec3.1021c","type":"ui_tab","name":"Sensor Graph","icon":"dashboard","disabled":false,"hidden":false}]
Below is the output
{"mode":0,"odr":"400Hz","temperature":26.76,"x_rms_ACC_G":0.128,"x_max_ACC_G":0.132,"x_velocity_mm_sec":2.43,"x_displacement_mm":0.01,"x_peak_one_Hz":197,"x_peak_two_Hz":0,"x_peak_three_Hz":0,"y_rms_ACC_G":0.297,"y_max_ACC_G":0.312,"y_velocity_mm_sec":5.09,"y_displacement_mm":0.03,"y_peak_one_Hz":197,"y_peak_two_Hz":0,"y_peak_three_Hz":0,"z_rms_ACC_G":0.194,"z_max_ACC_G":0.186,"z_velocity_mm_sec":3.94,"z_displacement_mm":0.03,"z_peak_one_Hz":197,"z_peak_two_Hz":181,"z_peak_three_Hz":176}
How do I resolve my X-axis on my dashboard? I keep on getting 00:00:00 on my X-axis, I would like to have time based on my PC (Real-Time Clock)
Copyright OpenJS Foundation and Node-RED contributors. All rights reserved. The OpenJS Foundation has registered trademarks and uses trademarks. For a list of trademarks of the OpenJS Foundation, please see our Trademark Policy and Trademark List. Trademarks and logos not indicated on the list of OpenJS Foundation trademarks are trademarks™ or registered® trademarks of their respective holders. Use of them does not imply any affiliation with or endorsement by them.
The OpenJS Foundation | Terms of Use | Privacy Policy | OpenJS Foundation Bylaws | Trademark Policy | Trademark List | Cookie Policy


