I am posting it for first time here. Need some help with displaying my values from Dynamodb into a chart. Just using a node-red for first time. I was able to change the information and arrange into the Array using the Function node. Then futher I converted it using th Change Array to get it to plot. But I am not seeing any data in the chart.
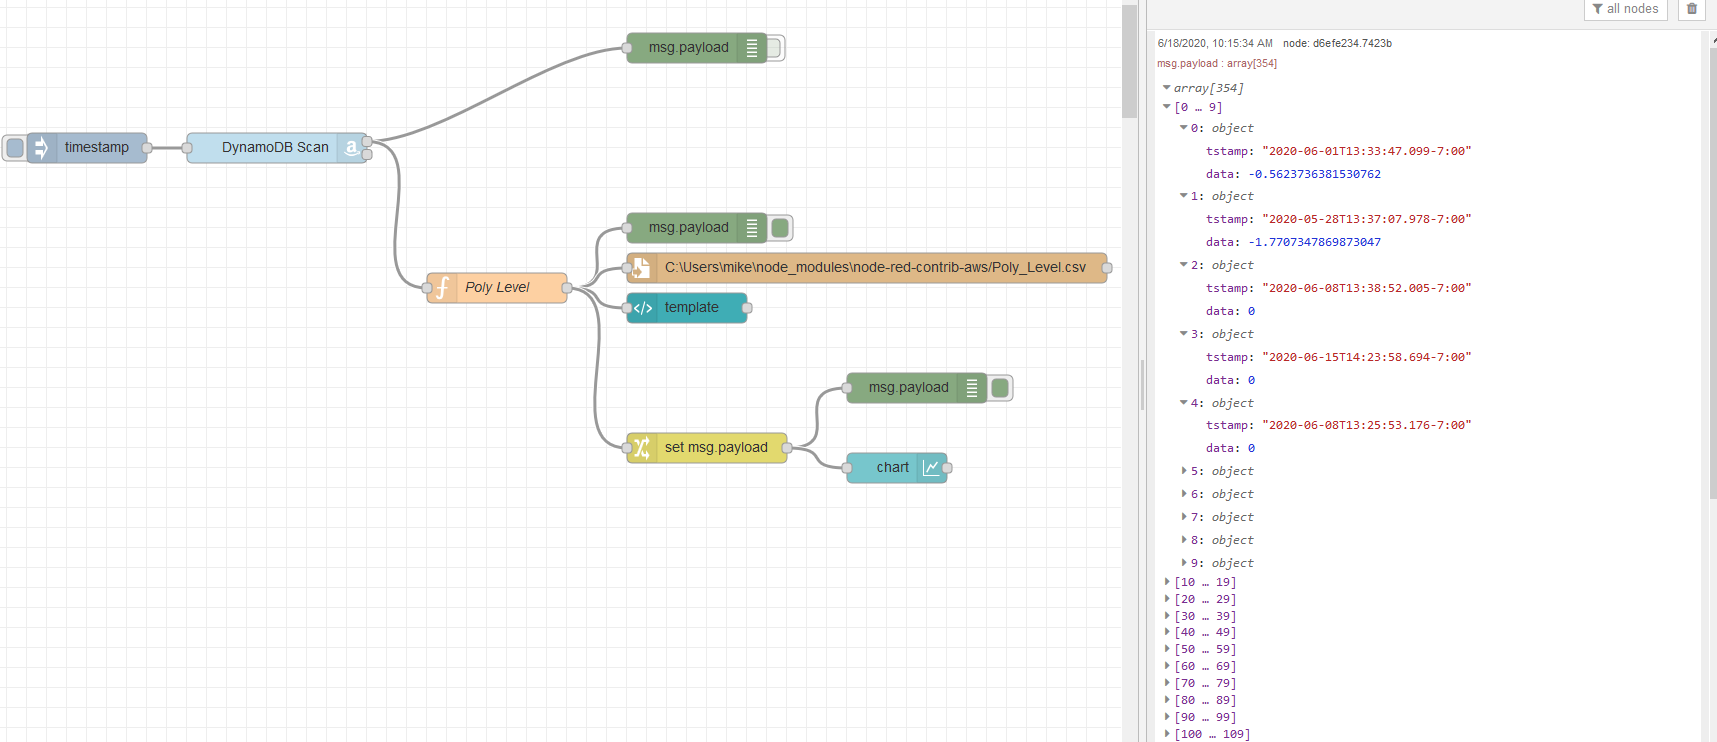
If you look at the docs for the chart node in the section for Line Charts under Stored Data it shows you the data structure you need. You can see that the object passed should contain attributes seriesdata and labels and each data point should contain attributes x and y. Looking at your debug output it does not appear to match the structure in the docs.
Still not quite right, it is essential to get the details right when dealing with computers. Look at the docs again and you will see that data is an array of arrays (one for each series) whereas you just have it as an array. You can fix that by changing the data line near the end from data: myArray,
to data: [myArray]
You don't need the quotes round the attribute name data when creating javascript objects unless the name has special characters such as a space or minus or starts with a digit.
Also are your timestamps strings or javascript milliseconds timestamps as in the docs? The debug window may be converting them for display so I am not certain. I don't know whether the chart will cope with string timestamps, it may well be ok. If you find it still doesn't work after correcting the arrays then try this to turn them into ticks x: new Date(msg.payload.items[i].blah.blah.S).getTime()
I notice that you have a trailing comma on the end of the y: line that should not be there.
Hint: to build an array you can use myArray.push(element) which adds an element to the end of the array, that will simplify your loop.
More advanced hint: to make the code really cool you can use Array.map() to create an array (myArray) from another (msg.payload.items) by providing a function to do the mapping so you don't need to explicitly iterate the array at all. Make a note to look at that some time when you have some experience with javascript.
By the way, if posting code again please copy/paste the text rather than screenshot, it makes life easier at this end as I could have copied bits of your code rather than having to re-type it. To paste code (or exported flows) got to a new line then click the </> button and paste the code where it indicates.