Possibility to hide the lines in a line chart

Hi folks,

Currently I show a line chart with enlarged points for a large number of line charts:

But I would like to show only the points, but not the lines connecting those points...
Does anybody knows how to do that?

I expect that I will get an answer like: "when you don't want lines, then don't use a line chart" :wink:
But in that case, I am not sure what is the best way to solve this in a simple way then...

Thanks!!
Bart

P.S. for every X-axis value I show e.g. 100 Y-axis values (dots).
Which is of course slow when using a line chart.

You can send an x value with a y value of null and that will break the line. Of course in this case it will mean twice the number of points which will make it even slower…
So a complete new x/y chart in a ui-template may be better. I’m sure @hotnipi had an example in the forum.

you could use the template node to create your own chart.js chart instead of the chart node.
this way you can use the type of chart as scatter and in datasets showLine: false

Example :

[{"id":"d58b635f1bfdaa7f","type":"ui_template","z":"4895ea10b4ee9ead","group":"6efcc19883dcdf68","name":"","order":0,"width":0,"height":0,"format":"<canvas id=\"myChart\" width=\"400\" height=\"300\"></canvas>\n<script>\n  var ctx = document.getElementById(\"myChart\").getContext('2d');\n  var scatterChart = new Chart(ctx, {\n    type: \"scatter\",\n    data: {\n      datasets: [\n        {\n          label: \"Scatter Dataset\",\n          data: [\n            {\n              x: -10,\n              y: 0,\n            },\n            {\n              x: 0,\n              y: 10,\n            },\n            {\n              x: 10,\n              y: 5,\n            },\n          ],\n          showLine: false,\n          borderColor: 'rgba(0, 200, 0, 1)'\n        },\n      ],\n    },\n    options: {\n      scales: {\n        xAxes: [\n          {\n            type: \"linear\",\n            position: \"bottom\",\n          },\n        ],\n      },\n      \n      responsive: true, // Instruct chart js to respond nicely.\n      maintainAspectRatio: false, // Add to prevent default behaviour of full-width/height\n      \n    },\n  });\n</script>","storeOutMessages":true,"fwdInMessages":true,"resendOnRefresh":true,"templateScope":"local","x":560,"y":540,"wires":[[]]},{"id":"6efcc19883dcdf68","type":"ui_group","name":"Default","tab":"39a6d442788cfb84","order":1,"disp":true,"width":"24","collapse":false},{"id":"39a6d442788cfb84","type":"ui_tab","name":"Home","icon":"dashboard","disabled":false,"hidden":false}]

ps . in the example i didnt implement receiving the data from the previous node.

2 Likes

Here's an example which limits the number of datapoints in the chart, and in this example removes datapoints older than 10 seconds.
It also re-draws the plot when a browser connects or a reboot. (@hotNipi helped me with this :slightly_smiling_face:)
NB I've left the function nodes separate so it's easier to see what each part of the flow does

[{"id":"9e69a15c.275b7","type":"function","z":"c4396940.2c4cc8","name":"Format incoming data","func":"var msg0 = {};\nvar msg1 = {};\nvar msg2 = {};\n\nmsg0.payload = msg.heater;\nmsg0.topic = 'heater';\n\nmsg1.payload = msg.temp;\nmsg1.topic = 'temp';\n\nmsg2.payload = msg.target;\nmsg2.topic = 'target';\n\nreturn [[msg0,msg1,msg2]];","outputs":1,"noerr":0,"initialize":"","finalize":"","x":400,"y":1000,"wires":[["2ea25389.533f4c"]]},{"id":"e3e7d295.96c1","type":"ui_template","z":"c4396940.2c4cc8","group":"12bd1e56.84a0c2","name":"Line Chart","order":4,"width":"12","height":"6","format":"","storeOutMessages":true,"fwdInMessages":true,"resendOnRefresh":false,"templateScope":"local","x":790,"y":1000,"wires":[[]]},{"id":"e29023d4.a722d","type":"template","z":"c4396940.2c4cc8","name":"Initialisation","field":"template","fieldType":"msg","format":"html","syntax":"mustache","template":"<canvas id=\"myChart\" width=1200 height=500></canvas>\n<script>\nvar textcolor = getComputedStyle(document.documentElement).getPropertyValue('--nr-dashboard-widgetTextColor');\nvar gridcolor = getComputedStyle(document.documentElement).getPropertyValue('--nr-dashboard-groupBorderColor');\nvar linecolors = ['#5d60ff','#24f21d','#f7bcc0']\n\nvar ctx = document.getElementById('myChart').getContext('2d');\nvar chart = new Chart(ctx, {\n    // The type of chart we want to create\n    type: 'line',\n\n    // The data for our dataset\n    data: {\n        labels: [],\n        datasets: [\n            {\n                label: 'temp',\n                backgroundColor: linecolors[0],\n                borderColor: linecolors[0],\n                data: [],\n                yAxisID: 'left-y-axis',\n                steppedLine: false,\n                fill: false,\n                radius: 0,\n                hitRadius: 8,\n                borderWidth: 1\n            },\n            {\n                label: 'target',\n                backgroundColor: linecolors[1],\n                borderColor: linecolors[1],\n                data: [],\n                yAxisID: 'left-y-axis',\n                lineTension: 0,\n                steppedLine: false,\n                fill: false,\n                radius: 0,\n                hitRadius: 8,\n                borderWidth: 1\n            },\n                        {\n                label: 'heater',\n                backgroundColor: linecolors[2],\n                borderColor: linecolors[2],\n                data: [],\n                yAxisID: 'left-y-axis',\n                lineTension: 0,\n                steppedLine: true,\n                fill: true,\n                radius: 0,\n                hitRadius: 8,\n                borderWidth: 1\n            }\n        ]\n    },\n\n    // Configuration options go here\n    options: {\n        scales: {\n            yAxes: [\n                {\n                    scaleLabel: {\n                    //display: true,\n                    //labelString: 'Temperature °C',\n                    fontColor: linecolors[0]\n                    },\n                    gridLines :{display:false},\n                    id: 'left-y-axis',\n                    type: 'linear',\n                    position: 'left',\n                    ticks: {\n                        fontColor: linecolors[0]\n                    }\n                }\n            ],\n            xAxes: [\n                {\n                    gridLines :{zeroLineColor:gridcolor,color:gridcolor,lineWidth:0.5},\n                    type: 'time',\n                    distribution: 'series',\n                    time:{\n                        tooltipFormat:'HH:mm:ss',\n                        displayFormats: {\n                            quarter: 'MMM YYYY',\n                            millisecond:'HH:mm:ss.SSS',\n                            second:\t'HH:mm:ss',\n                            minute:\t'HH:mm',\n                            hour:\t'HH'                        \n                        }\n                    },\n                    \n                    ticks: {\n                        fontColor:textcolor\n                    }\n                }\n            ]\n        },\n        elements: {\n            point:{\n                radius:1.5\n            }\n        }\n    }\n});\nfunction addData(chart, data, label) {\n    // same calculation as for data storage at server side\n    // data.x is newest data so treated as now.\n    var old = data.x - 10000 \n    \n    chart.data.datasets.forEach((dataset) => {\n        if(dataset.label == label){\n            dataset.data.push(data);\n        }\n        dataset.data = dataset.data.filter(entry => entry.x > old)// filter out old data.\n        \n    });\n    chart.update(0);//0 means no animation\n}\nfunction restoreChart(chart, data) {\n    // overwrite datasets (but not clear all)\n    // based on incoming data\n    // if chart has datasets which then not found from icoming data, those remain\n    var dataset\n    Object.keys(data).forEach(label => {\n        dataset = chart.data.datasets.find(ds => {return ds.label === label })// find corresponding dataset\n        if(dataset){\n            dataset.data = data[label]// if found, replace with incoming data for that dataset\n        }\n    })\n    chart.update(0);//0 means no animation\n}\n(function(scope) {\n    scope.$watch('msg', function(msg) {\n        if(msg) {\n            if (msg.topic == \"restore\") {\n                // restore chart\n                restoreChart(chart, msg.payload)\n            }\n            else{\n                //add datapoints one by one\n                addData(chart, msg.payload, msg.topic)\n            }\n        }\n   \n  });\n})(scope);\n</script>\n","output":"str","x":610,"y":920,"wires":[["e3e7d295.96c1"]]},{"id":"2140807.c5df78","type":"inject","z":"c4396940.2c4cc8","name":"Initialize","props":[{"p":"payload"},{"p":"topic","vt":"str"}],"repeat":"","crontab":"","once":true,"onceDelay":0.1,"topic":"","payload":"","payloadType":"date","x":495,"y":920,"wires":[["e29023d4.a722d"]],"l":false},{"id":"e8f6de10.fc142","type":"ui_ui_control","z":"c4396940.2c4cc8","name":"","events":"connect","x":435,"y":960,"wires":[["d8559393.11195"]],"l":false},{"id":"2ea25389.533f4c","type":"function","z":"c4396940.2c4cc8","name":"store data","func":"var storage = flow.get('ghData') || {temp:[],target:[],heater:[]} // data structure to match the chart datasets\n\nvar now = new Date().getTime() // the moment of datapoint creation\nvar old = now - 10000  // too old data will be removed\nvar datapoint = {x:now, y:msg.payload} // create the datapoint\n\nstorage[msg.topic].push(datapoint) // push datapoint into correct object's array in storage\n\nstorage[msg.topic] = storage[msg.topic].filter(entry => entry.x > old)// filter out any too old data\n\nflow.set('ghData',storage)// write storage to flow context\n\nmsg.payload = datapoint // send out the created datapoint (msg.topic remains same)\nreturn msg;","outputs":1,"noerr":0,"initialize":"","finalize":"","x":600,"y":1000,"wires":[["e3e7d295.96c1"]]},{"id":"3f837ff4.6f9f1","type":"change","z":"c4396940.2c4cc8","name":"Restore","rules":[{"t":"set","p":"payload","pt":"msg","to":"ghData","tot":"flow"},{"t":"set","p":"topic","pt":"msg","to":"restore","tot":"str"}],"action":"","property":"","from":"","to":"","reg":false,"x":600,"y":960,"wires":[["e3e7d295.96c1"]]},{"id":"d8559393.11195","type":"switch","z":"c4396940.2c4cc8","name":"","property":"ghData","propertyType":"flow","rules":[{"t":"nnull"}],"checkall":"true","repair":false,"outputs":1,"x":495,"y":960,"wires":[["3f837ff4.6f9f1"]],"l":false},{"id":"8c1eeba5.707ff8","type":"inject","z":"c4396940.2c4cc8","name":"","props":[{"p":"payload"},{"p":"topic","vt":"str"}],"repeat":"1","crontab":"","once":true,"onceDelay":0.1,"topic":"","payload":"","payloadType":"str","x":75,"y":1000,"wires":[["c74a8401.c84028"]],"l":false},{"id":"c74a8401.c84028","type":"change","z":"c4396940.2c4cc8","name":"Example Data","rules":[{"t":"set","p":"temp","pt":"msg","to":"$floor($random()*10)","tot":"jsonata"},{"t":"set","p":"target","pt":"msg","to":"$floor($random()*10)","tot":"jsonata"},{"t":"set","p":"heater","pt":"msg","to":"$floor($random()*10)","tot":"jsonata"}],"action":"","property":"","from":"","to":"","reg":false,"x":200,"y":1000,"wires":[["9e69a15c.275b7"]]},{"id":"12bd1e56.84a0c2","type":"ui_group","z":"","name":"Default","tab":"ad4af309.f85ed","order":1,"disp":false,"width":"12","collapse":false},{"id":"ad4af309.f85ed","type":"ui_tab","z":"","name":"Home","icon":"dashboard","order":4,"disabled":false,"hidden":false}]

EDIT 2pm 31/7 - spotted typo in flow, now corrected!

chart

3 Likes

Thumb rules:
Always use dedicated chart type.
Always optimize the data.
Larger the dataset, more strictly you will need to take the rules

1 Like

Any good...

1 Like

Thanks again guys!!!!
I'm going to experiment with those proposals tonight. Now the lady of the house has other (non Node-RED related) tasks for her humble servant :cold_face:

I discovered a new problem with the Node-RED community. Since multiple high quality solutions are presented, you have to choose one of those :roll_eyes:

Based on @hotNipi's advised, I have dropped my idea of a line chart and selected the scatter chart proposal from @Steve-Mcl. But the other ideas would have solved my problem also!!

I had two minor issues with the scatter chart example flow from Steve:

  1. None of my (other) charts were working anymore due to this error:

    image

    I "assume" that was related to a new version of chartjs downloaded by this node:

    image

    Because when I removed that node, it was solved ...
    Not sure anyway why I need to load the chartjs library, since the dashboard seems already to have it?

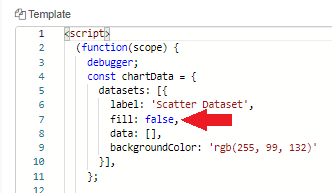
  2. The area below the dots was filled, which made no sense in my use case:

    image

    So I added a parameter in the Template-node to avoid filling:

    image

    And then this was solved:

    image

My use case is solved. I got a clear graph which is rendered very quickly.

Thanks to all and have a nice sunday!
Bart

4 Likes

@BartButenaers Bart, here is a writeup I did and put in the flow library a couple years ago incase it will be of any help:
https://flows.nodered.org/flow/d1b9f2c606e536ce4a3960abcd887754

2 Likes

Hi Paul,
A bubble chart. I love it already due to that name :wink:
That could indeed be useful for my case. Especially the colors. Need to digest the ideas...
Thanks!!

I realise your issues have been resolved, but I thought others might be interested in my "thinking outside the box" approach using Google Sheets to create an interactive Timeline point Chart embedded in an iframe in a ui_template on the node red dashboard. Various other charts are available in Sheets. The approach is more useful when there is no need for immediacy in updating the chart, but if you can accept a few minutes delay in the display refreshing, then it is very flexible.
Google Sheets and Node Red.

Hi @PdeJ,
Thanks for joining! Yes that indeed looks like a very decent alternative. Only disadvantage is that it requires an online connection to do the calculations in the cloud...

In my use case it would be useful to see quickly the points that differ more than x percentage from the average points. Points that differ too much need to become red, while other points (near the average) need to be green.

Did it by passing an array (containing a color hex value for each node) to the pointBackgroundColor input property in Steve's example flow:

image

Which results in this:

image

Just sharing it in case anybody else ever needs something similar ...

This topic was automatically closed 14 days after the last reply. New replies are no longer allowed.