Problem getting Graph to display

I am trying to get a graph from my roomtemperature.
I found some examples and it took me a while to get them working but I managed.
I have a database with an ID, sensornumber, value and a sql generated timestamp.
Whatever I try, I don't see anything on my graph.
This is my flow:

[{"id":"57ae6962.0687b8","type":"tab","label":"Grafiek kamertemp","disabled":false,"info":""},{"id":"4bfec7e1.b008c","type":"template","z":"57ae6962.0687b8","name":"format query wk","field":"topic","fieldType":"msg","format":"handlebars","syntax":"mustache","template":"SELECT mw_data \nFROM meetwaarden \nWHERE mw_se_id = 1\n    AND mw_timestamp > \"{{payload}}\"","output":"str","x":660,"y":80,"wires":[["a7458f1c.229c78","78527ea9.9c2d68"]]},{"id":"e555e6b6.6a363","type":"debug","z":"57ae6962.0687b8","name":"1","active":false,"tosidebar":true,"console":false,"tostatus":false,"complete":"payload","targetType":"msg","x":630,"y":40,"wires":[]},{"id":"a7458f1c.229c78","type":"debug","z":"57ae6962.0687b8","name":"2","active":false,"tosidebar":true,"console":false,"tostatus":false,"complete":"payload","targetType":"msg","x":870,"y":80,"wires":[]},{"id":"9abd05c0.629ab","type":"function","z":"57ae6962.0687b8","name":"convert","func":"if ( !msg.timestamp ) msg.timestamp = Math.round(+new Date());\n\nvar dt = new Date(msg.payload);\nvar Y = dt.getFullYear().toString();\nvar M = (dt.getMonth() + 1).toString();\nif((dt.getMonth() + 1)<=9){M='0'+M}\nvar D = dt.getDate().toString();\nif(dt.getDate()<=9){D='0'+D}\nvar H = dt.getHours().toString();\nif(dt.getHours()<=9){H='0'+H}\nvar m = dt.getMinutes().toString();\nif(dt.getMinutes()<=9){m='0'+m}\n//var S = dt.getMilliseconds().toString();\nmsg.payload = Y+'-'+M+'-'+D+' '+H+':'+m+':'+'00';\n\nreturn msg;","outputs":1,"noerr":0,"x":440,"y":80,"wires":[["e555e6b6.6a363","4bfec7e1.b008c"]]},{"id":"6ef19a5d.2508d4","type":"inject","z":"57ae6962.0687b8","name":"","topic":"","payload":"","payloadType":"date","repeat":"","crontab":"","once":false,"onceDelay":0.1,"x":100,"y":80,"wires":[["84775b33.2d0af"]]},{"id":"77b08af2.e488d4","type":"ui_chart","z":"57ae6962.0687b8","name":"Kamer temperatuur","group":"d3e2514d.48f4c","order":1,"width":0,"height":0,"label":"Kamer temperatuur","chartType":"line","legend":"false","xformat":"HH:mm","interpolate":"linear","nodata":"","dot":false,"ymin":"","ymax":"","removeOlder":"24","removeOlderPoints":"","removeOlderUnit":"3600","cutout":0,"useOneColor":false,"useUTC":false,"colors":["#1f77b4","#aec7e8","#ff7f0e","#2ca02c","#98df8a","#d62728","#ff9896","#9467bd","#c5b0d5"],"useOldStyle":false,"outputs":1,"x":610,"y":180,"wires":[["4373954c.03ee0c"]]},{"id":"8525cd85.66fa48","type":"change","z":"57ae6962.0687b8","name":"Format data WK","rules":[{"t":"set","p":"payload","pt":"msg","to":"(\t  $series := [\t    { \"field\": \"mw_data\", \"label\": \"Kamertemp\" }\t  ];\t  $xaxis := \"timestamp\";\t  [\t    {\t      \"series\": $series.label,\t      \"data\": $series.[\t        (\t          $yaxis := $.field;\t          $$.payload.{\t            \"x\": $lookup($, $xaxis),\t            \"y\": $lookup($, $yaxis)\t          }\t        )\t      ]\t    }\t  ]\t)","tot":"jsonata"}],"action":"","property":"","from":"","to":"","reg":false,"x":340,"y":180,"wires":[["ab2f4d1e.a881f8","77b08af2.e488d4"]]},{"id":"78527ea9.9c2d68","type":"mysql","z":"57ae6962.0687b8","mydb":"98a864b9.d0edb","name":"MYSQL","x":120,"y":180,"wires":[["2b2c2b71.f0d6cc","8525cd85.66fa48"]]},{"id":"2b2c2b71.f0d6cc","type":"debug","z":"57ae6962.0687b8","name":"3","active":true,"tosidebar":true,"console":false,"tostatus":false,"complete":"payload","targetType":"msg","x":310,"y":240,"wires":[]},{"id":"ab2f4d1e.a881f8","type":"debug","z":"57ae6962.0687b8","name":"4","active":true,"tosidebar":true,"console":false,"tostatus":false,"complete":"payload","targetType":"msg","x":530,"y":240,"wires":[]},{"id":"84775b33.2d0af","type":"function","z":"57ae6962.0687b8","name":"Criteria","func":"var timeE = msg.payload;\n//Restrict the query to pull the last 24hrs\n//of data instead of the whole db\nmsg.payload = (timeE - (1000*60*5));\n    node.status({text:msg.payload});\nreturn msg;","outputs":1,"noerr":0,"x":260,"y":80,"wires":[["9abd05c0.629ab"]]},{"id":"4373954c.03ee0c","type":"debug","z":"57ae6962.0687b8","name":"5","active":true,"tosidebar":true,"console":false,"tostatus":false,"complete":"payload","targetType":"msg","x":810,"y":240,"wires":[]},{"id":"d3e2514d.48f4c","type":"ui_group","z":"","name":"Grafieken","tab":"e62eb9b.f9d3cc8","order":2,"disp":true,"width":"6","collapse":false},{"id":"98a864b9.d0edb","type":"MySQLdatabase","z":"","name":"","host":"127.0.0.1","port":"3306","db":"Huismanager","tz":""},{"id":"e62eb9b.f9d3cc8","type":"ui_tab","z":"","name":"Grafieken","icon":"dashboard","order":2,"disabled":false,"hidden":false}]

this is what is displayed by debug3:

5-4-2020 13:36:24node: 3
SELECT mw_data FROM meetwaarden WHERE mw_se_id = 1 AND mw_timestamp > "2020-04-05 13:31:00" : msg.payload : array[6]
array[6]
0: object
mw_data: "21.84"
1: object
mw_data: "21.85"
2: object
mw_data: "21.84"
3: object
mw_data: "21.85"
4: object
mw_data: "21.87"
5: object
mw_data: "21.92"

I tried to modify the javascript in the "Format data WK" but I am sure I do something wrong (otherwise it would have worked)
Can anybody give me some hint how to get this working?

-Warner-

If you want to display an array of data, you need to provide the x-axis (time) and a value for the y-axis.
See the documentation

I cannot figure out how to do it with that info.
I tried the JSONata excercise but I do not understand anything of it

The chart accepts 3 types of data:

timebased, non-time based, (and/or) live data

Do you want a line or barchart ?

For a timebased line chart msg.payload needs to be formatted like (example has 3 series, you have only 1):

[{
"series": ["A", "B", "C"],
"data": [
    [{ "x": 1504029632890, "y": 5 },
     { "x": 1504029636001, "y": 4 },
     { "x": 1504029638656, "y": 2 }
    ],
    [{ "x": 1504029633514, "y": 6 },
     { "x": 1504029636622, "y": 7 },
     { "x": 1504029639539, "y": 6 }
    ],
    [{ "x": 1504029634400, "y": 7 },
     { "x": 1504029637959, "y": 7 },
     { "x": 1504029640317, "y": 7 }
    ]
],
"labels": [""]
}]

So your array with objects needs to be reformatted as such, either with a function node or jsonata.
On google you can find many examples on how to deal with arrays/objects and rewriting them. The x values are unix timestamps. The query should include the timestamps (eg. SELECT mw_timestamp,mw_data) to make it easier, the database can also convert the timestamp directly in the correct format (ie; select UNIX_TIMESTAMP(mw_timestamp) - depending on the type of database and correct timestamp format)

Sorry, but all I can find as examples are different layouts. I tried JSONata but that gives no output either. And the problem is that now the timestamp has a label UNIX_TIMESTAMP(mw_timestamp).
I am getting desperate.
And there are a lot of beginners who have problems with this so this is not easy. I think I have to skip graphs.

Provide the following and we'll show you how...

  • Your SQL query (include TOP 10 to limit size to small sample)
  • Sample output data - as copied from the a debug output
  • What graph style you want (line/bar)
  • What field the X value is, what field the Y value is

I have now this:

[{"id":"4bfec7e1.b008c","type":"template","z":"57ae6962.0687b8","name":"format query wk","field":"topic","fieldType":"msg","format":"handlebars","syntax":"mustache","template":"SELECT UNIX_TIMESTAMP(mw_timestamp),mw_data \nFROM meetwaarden \nWHERE mw_se_id = 1\n    AND mw_timestamp > \"{{payload}}\"","output":"str","x":660,"y":80,"wires":[["a7458f1c.229c78","78527ea9.9c2d68"]]},{"id":"e555e6b6.6a363","type":"debug","z":"57ae6962.0687b8","name":"1","active":false,"tosidebar":true,"console":false,"tostatus":false,"complete":"payload","targetType":"msg","x":630,"y":40,"wires":[]},{"id":"a7458f1c.229c78","type":"debug","z":"57ae6962.0687b8","name":"2","active":true,"tosidebar":true,"console":false,"tostatus":false,"complete":"payload","targetType":"msg","x":870,"y":80,"wires":[]},{"id":"9abd05c0.629ab","type":"function","z":"57ae6962.0687b8","name":"convert","func":"if ( !msg.timestamp ) msg.timestamp = Math.round(+new Date());\n\nvar dt = new Date(msg.payload);\nvar Y = dt.getFullYear().toString();\nvar M = (dt.getMonth() + 1).toString();\nif((dt.getMonth() + 1)<=9){M='0'+M}\nvar D = dt.getDate().toString();\nif(dt.getDate()<=9){D='0'+D}\nvar H = dt.getHours().toString();\nif(dt.getHours()<=9){H='0'+H}\nvar m = dt.getMinutes().toString();\nif(dt.getMinutes()<=9){m='0'+m}\n//var S = dt.getMilliseconds().toString();\nmsg.payload = Y+'-'+M+'-'+D+' '+H+':'+m+':'+'00';\n\nreturn msg;","outputs":1,"noerr":0,"x":440,"y":80,"wires":[["e555e6b6.6a363","4bfec7e1.b008c"]]},{"id":"6ef19a5d.2508d4","type":"inject","z":"57ae6962.0687b8","name":"","topic":"","payload":"","payloadType":"date","repeat":"","crontab":"","once":false,"onceDelay":0.1,"x":100,"y":80,"wires":[["84775b33.2d0af"]]},{"id":"77b08af2.e488d4","type":"ui_chart","z":"57ae6962.0687b8","name":"Kamer temperatuur","group":"d3e2514d.48f4c","order":1,"width":0,"height":0,"label":"Kamer temperatuur","chartType":"line","legend":"false","xformat":"HH:mm","interpolate":"linear","nodata":"","dot":false,"ymin":"","ymax":"","removeOlder":"24","removeOlderPoints":"100","removeOlderUnit":"604800","cutout":0,"useOneColor":false,"useUTC":false,"colors":["#1f77b4","#aec7e8","#ff7f0e","#2ca02c","#98df8a","#d62728","#ff9896","#9467bd","#c5b0d5"],"useOldStyle":false,"outputs":1,"x":610,"y":180,"wires":[["4373954c.03ee0c"]]},{"id":"8525cd85.66fa48","type":"change","z":"57ae6962.0687b8","name":"Format data WK","rules":[{"t":"set","p":"payload","pt":"msg","to":"(\t  $series := [\t    { \"field\": \"mw_data\", \"label\": \"Kamertemp\" }\t  ];\t  $xaxis := \"UNIX_TIMESTAMP(mw_timestamp)\";\t  [\t    {\t      \"series\": $series.label,\t      \"data\": $series.[\t        (\t          $yaxis := $.field;\t          $$.payload.{\t            \"x\": $lookup($, $xaxis),\t            \"y\": $lookup($, $yaxis)\t          }\t        )\t      ]\t    }\t  ]\t)","tot":"jsonata"}],"action":"","property":"","from":"","to":"","reg":false,"x":340,"y":180,"wires":[["ab2f4d1e.a881f8","77b08af2.e488d4"]]},{"id":"78527ea9.9c2d68","type":"mysql","z":"57ae6962.0687b8","mydb":"98a864b9.d0edb","name":"MYSQL","x":120,"y":180,"wires":[["2b2c2b71.f0d6cc","8525cd85.66fa48"]]},{"id":"2b2c2b71.f0d6cc","type":"debug","z":"57ae6962.0687b8","name":"3","active":true,"tosidebar":true,"console":false,"tostatus":false,"complete":"payload","targetType":"msg","x":310,"y":240,"wires":[]},{"id":"ab2f4d1e.a881f8","type":"debug","z":"57ae6962.0687b8","name":"4","active":true,"tosidebar":true,"console":false,"tostatus":false,"complete":"payload","targetType":"msg","x":530,"y":240,"wires":[]},{"id":"84775b33.2d0af","type":"function","z":"57ae6962.0687b8","name":"Criteria","func":"var timeE = msg.payload;\n//Restrict the query to pull the last 24hrs\n//of data instead of the whole db\nmsg.payload = (timeE - (1000*60*5));\n    node.status({text:msg.payload});\nreturn msg;","outputs":1,"noerr":0,"x":260,"y":80,"wires":[["9abd05c0.629ab"]]},{"id":"4373954c.03ee0c","type":"debug","z":"57ae6962.0687b8","name":"5","active":true,"tosidebar":true,"console":false,"tostatus":false,"complete":"payload","targetType":"msg","x":810,"y":240,"wires":[]},{"id":"d3e2514d.48f4c","type":"ui_group","z":"","name":"Grafieken","tab":"e62eb9b.f9d3cc8","order":2,"disp":true,"width":"6","collapse":false},{"id":"98a864b9.d0edb","type":"MySQLdatabase","z":"","name":"","host":"127.0.0.1","port":"3306","db":"Huismanager","tz":""},{"id":"e62eb9b.f9d3cc8","type":"ui_tab","z":"","name":"Grafieken","icon":"dashboard","order":2,"disabled":false,"hidden":false}]

Which gives me at debug 4:

8-4-2020 16:15:39node: 4
SELECT UNIX_TIMESTAMP(mw_timestamp),mw_data FROM meetwaarden WHERE mw_se_id = 1 AND mw_timestamp > "2020-04-08 16:10:00" : msg.payload : array[1]
array[1]
0: object
series: "Kamertemp"
data: array[6]
0: object
x: 1586355009
y: "23.65"
1: object
x: 1586355069
y: "23.66"
2: object
x: 1586355129
y: "23.67"
3: object
x: 1586355189
y: "23.67"
4: object
x: 1586355249
y: "23.67"
5: object
x: 1586355309
y: "23.67"

I now have the x and the y and still the graph is empty...
Is now the timestamp (x) too small?
This is what I have in my Format data WK:

(
  $series := [
    { "field": "mw_data", "label": "Kamertemp" }
  ];
  $xaxis := "UNIX_TIMESTAMP(mw_timestamp)";
  [
    {
      "series": $series.label,
      "data": $series.[
        (
          $yaxis := $.field;
          $$.payload.{
            "x": $lookup($, $xaxis),
            "y": $lookup($, $yaxis)
          }
        )
      ]
    }
  ]
)

I was a little desperate, but cannot give up :wink: And time enough through covid-19....

We need your original data not processed data....

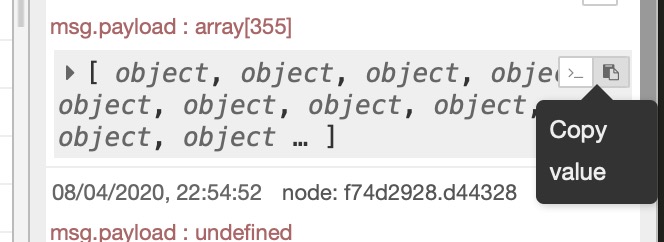
use the copy button in debug bar
image

Forgot you need to have the timestamp in nano seconds, could you try UNIX_TIMESTAMP(mw_timestamp)*1000

I found this to multiply by 1000:

(
  $series := [
    { "field": "mw_data", "label": "Kamertemp" }
  ];
  $xaxis := "UNIX_TIMESTAMP(mw_timestamp)";
  [
    {
      "series": $series.label,
      "data": $series.[
        (
          $yaxis := $.field;
          $$.payload.{
            "x": $lookup($, $xaxis)*1000,
            "y": $lookup($, $yaxis)
          }
        )
      ]
    }
  ]
)

Now I have :slight_smile: (yes, 13 digits)

data: array[6]
0: object
x: 1586363049000
y: "23.54"

and still no line in the graph....

Don't forget the labels field (even if not used).
And series needs to be an array (same for labels)

Hmm, I followed https://flows.nodered.org/flow/13c55d1aa11e864609e24fa534a1fa26
and there is no labels field used there...

Chart documentation

To display a complete chart in one go - for example from a set of points retrieved from a database, the data must be supplied in the form of an array, that holds an object that has series , labels , and data arrays. This is broadly the same as the raw format used by the angular chart.js library.

You will need to process your data into this structure in order to render it correctly.

Hi Warnert, I've got it cooking here, this is the raw data off my temperature sensor (a Philips Hue Motion sensor)
{"celsius":19.44,"fahrenheit":66.99,"deviceValue":1944.0000000000002,"updated":"2020-04-08T19:34:01+01:00"}

I then pass this to a function node

return [
    { payload: msg.payload.celsius },
];

and then to a dashboard gauge and chart.
Screenshot 2020-04-08 at 19.41.44
Screenshot 2020-04-08 at 19.42.50

Hope this helps

Yes but he wants timeseries, not a single value.

apologies my bad

Ok, I found something. This is now my JSONata:

(
  $series := [
    { "field": "mw_data", "label": "Kamertemp" }
  ];
  $xaxis := "UNIX_TIMESTAMP(mw_timestamp)";
  [
    {
      "series": [$series.label],
      "labels": [$series.label],
      "data": $series.[
        (
          $yaxis := $.field;
          $$.payload.{
            "x": $lookup($, $xaxis)*1000,
            "y": $lookup($, $yaxis)
          }
        )
      ]
    }
  ]
)

In the debug window I get now:

8-4-2020 22:37:05node: 4
SELECT UNIX_TIMESTAMP(mw_timestamp),mw_data FROM meetwaarden WHERE mw_se_id = 1 AND mw_timestamp > "2020-04-08 22:32:00" : msg.payload : array[1]
array[1]
0: object
series: array[1]
labels: array[1]
data: array[5]
0: object
x: 1586377929000
y: "22.08"
1: object
2: object
3: object
4: object

So as you said series and labels are now arrays, but still no line :disappointed_relieved:

In debug window click this icon to copy the actual debug output and paste it here

Screenshot 2020-04-08 at 22.55.00

[{"series":["Kamertemp"],"labels":["Kamertemp"],"data":[{"x":1586379130000,"y":"22.02"},{"x":1586379190000,"y":"22.01"},{"x":1586379250000,"y":"21.98"},{"x":1586379310000,"y":"21.99"},{"x":1586379370000,"y":"21.98"},{"x":1586379430000,"y":"21.99"}]}]

This is just before the chart node

the values are strings, should be numbers