Question about memory leaking trough extensive use of node.status possible?

Hey there. As you might have noticed, I am doing some flow stuff with files on networks. Due to this, I created a pretty complex flow, analysing and parsing files and after that sending them to a MQTT broker.

NodeRED: 2.2.0
NodeJS: 16.3
OS: Windows

after some tests I found out, that somehow it suffers from a memory leak.

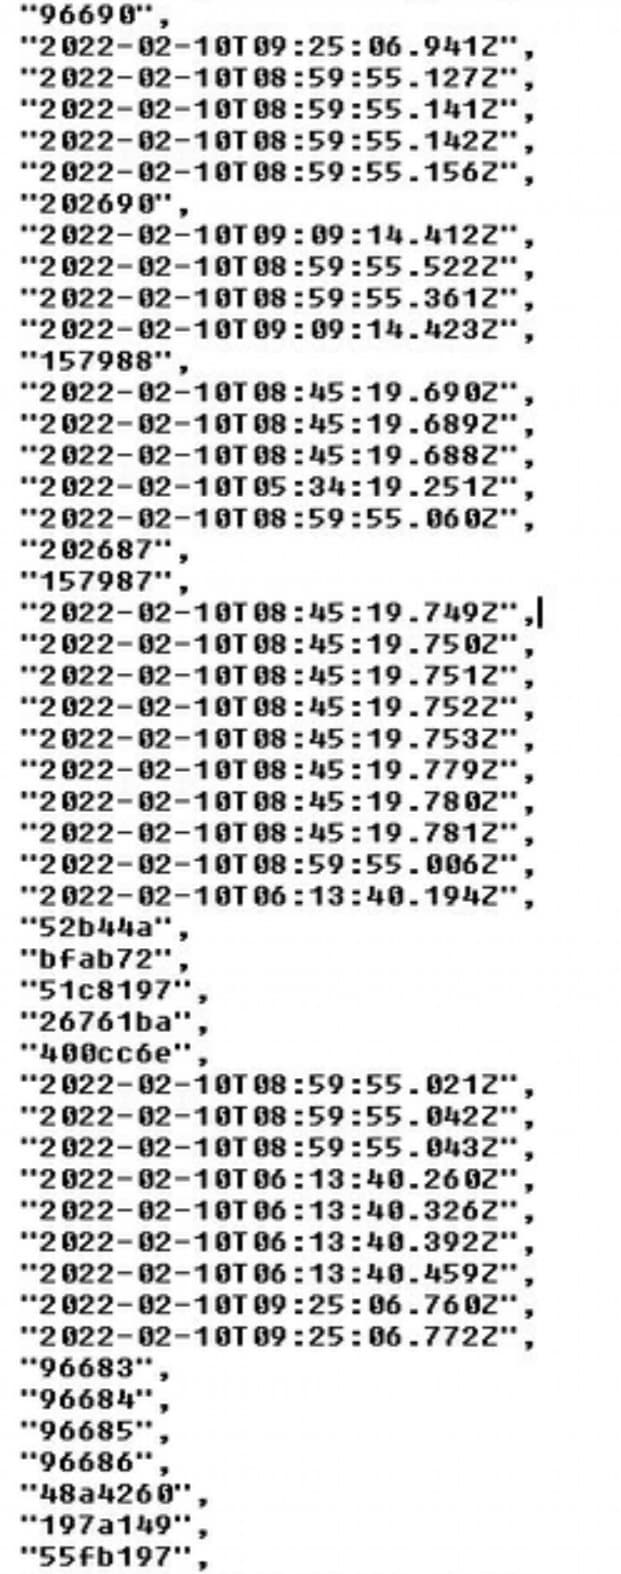
I did a HeapDump via v8 and if I look at the dump, i often see stuff like this:

Those are mostly dates created by the following codelines:

var sTime=new Date().toISOString();
node.status({text:  sTime});

or

var sTime=msg.Payload.Measurement.Timestamp;
node.status({text:  sTime});

where the msg.Payload.Measurement.Timestamp was created by something like

msg.Payload.Measurement.Timestamp=new Date(RAWData).toISOString();

That's strange. Looks like 90% of heap is filled with this stuff.

How do you know you have a leak?


this error comes every time... after restart ... a few hours later the HEAP grows. I included a v8 routine to get the state of heap and pass it to a ELK ... here is the graph.
right you see max(blue), red(used) and green(free) changing until (autimatic) restart after crash. Middle you see the asumpted size of my internal (flow) array containing some information (which file was read). Left you see some "limit" nodes how many files are in queue. Due to the timescale it looks "stable".

here you see a smaller time range...

List by inject always show aprox 80k for inject file list and 50k for the other dir. Both are piled up to 140k and processed until 0.
Even smaller range...

down to 6 min... you see mem consumtion increases if files are ingested.

in this small ragen you also see, that there is no more activity (no update on the left side, since the status update node does not see a value changing in any limit node).

And furthermore you see, that even while there are no files processed, memory consumption increases a bit ...

While there is NO file in the flow, I show some stats (with time of events like in this screenshot):


Below the nodes you see the times... and those values show up in the heap dump
image
Since the flow chechs every 20s if there are new files to process ... it shows the last time it checked.
And while files are processed, it updates the time shown for every file.
Also I use status node for showing the last message time when a certain path was activated by a incomming msg.

I aquire the the memory load by this function, triggered by ingest (1Hz) and forward to MQTT

let requireX = global.get('require');
const v8 = requireX('v8');
/*node.warn(`V8 Total Heap Size: ${(v8.getHeapStatistics().total_available_size / 1024 / 1024).toFixed(2)} MB`)
node.warn(`V8 Total Avail Heap Size: ${(v8.getHeapStatistics().total_heap_size / 1024 / 1024).toFixed(2)} MB`)
node.warn(`V8 Exec  Heap Size: ${(v8.getHeapStatistics().total_heap_size_executable / 1024 / 1024).toFixed(2)} MB`)
node.warn(`V8 Total Used  Heap Size: ${(v8.getHeapStatistics().used_heap_size / 1024 / 1024).toFixed(2)} MB`)

node.warn(JSON.stringify(process));
*/
//get the memory usage//
//let mem = process.memoryUsage();
//calc to MB 
const formatMem = (m) => (m / 1048576).toFixed(2)
if (!msg.Output.IoT.hasOwnProperty("Information")){
    msg.Output.IoT.Information = {};
}
msg.Output.IoT.Information.MemoryInfo = {};
msg.Output.IoT.Information.MemoryInfo.NodeJS = v8.getHeapStatistics();/* {
    ResidentSet: formatMem(mem.rss),
    Heap_Used: formatMem(mem.heapUsed),
    Heap_Total: formatMem(mem.heapTotal),
    'External C++': formatMem(mem.external),
    Unit:"MB"
}*/
msg.Output.IoT.Information.MemoryInfo.NodeJS.Unit="Byte";
node.status({ fill: "green", shape: "ring", text: "mem:" + v8.getHeapStatistics().used_heap_size  });

return msg

This code was implemented after I have seen the crashs.

This topic was automatically closed 60 days after the last reply. New replies are no longer allowed.