"RangeError: Maximum call stack size exceeded" on Finite State Machine application

Last week, I updated several nodes with the pallette manager in one of my projects that has several Finite State Machines to monitor and control mobile robots.

It had been running for several months without a hitch, but after updating a few nodes last week, whenever I reset the system, it works for about 5 hours, then I get this error: "RangeError: Maximum call stack size exceeded".

The change node that throws the error (AGV 58 CFG + STATUS) is the one that sets the configuration of the fleet manager to request the robot status, so I can evaluate it and feed it to the AGV STATE TRANSITIONS subflow.

After a few minutes, all the other AGVs have thrown the same error.

What puzzles me is that I never had the issue before this, even over a week of running non-stop. I have made no changes, except for updating some of the nodes.

If nothing in the flow changed, and you know what nodes you updated, you could go to the command line and reinstall the earlier version of the nodes and see if the problem goes away.

If it does, add the nodes back in one at a time, test. If there is no problem, repeat for the next node until you it the error.

Once you have identified which update cause the problem you could contact the node's author.

I am not sure of what nodes did I update, but the server where node-red is running has an automatic backup feature, so I will try rolling back the server about 2-3 weeks, and see what happens.

I still keep getting the same problem.

I did scrap the old flow and restarted from scratch, simplifying and structuring the data I store in global variables for more convenient access, and making sure I delete the payload from the messages before looping back to the Finite State machine.

In the past, I saw some data nesting in the Finite State Machine node if I tried to pass data along, so that's why I set up the global variables, because I didn't want the messages to grow out of proportion.

The current flow is attached as a
20210505-AGVs.json (122.6 KB)
JSON file.

I don't know where the problem might be. I have seen the CPU usage grows steadily after restarting the flows, and a few hours after, crashes with the MNaximum stack call problem.

For a finite state machine, I certainly need to loop back. I clear the messages before looping, and made sure that each transition branch can be called only on one state for each one of the robots.

I tried sorting the transitions and branches out neatly in subflows, but I don't know if that is the reason for the RangeError.

I activated the "info" logging in settings, but I can't see the console, since it starts as a scheduled task.

Why? What OS are you running on?

You said previously that the out of memory exception was happening in the Change node AGV 58 CSV + STATUS but I can't even find that in the flow you posted.

Also you said you were going to go back to a backup from a few weeks ago and see if the problem is cleared.

This is running on Windows Server.

As I pointed out in my previous post, I scrapped the old flow because it was extremely big, and I thought of some optimizations on the handling of the global variables I was using.

I posted this one because, for instance, the transition diagram that I use is much smaller, with only two states that come in play at the moment: OFFLINE and IDLE_NO_POS, which should be enough to monitor the robot data, as they feed back into the state machine after a few second delay.

The old transition subflow was a monolith that encompassed all the states in the FSM and barely fit in a single node-red tab (hence why I decided to break down the transitions in separate subflows:

  • AGV idling
  • Navigation (not yet implemented)
  • Docking (not yet implemented)
  • Job handling (not yet implemented)

I thought that it would be simpler to debug if I had a streamlined flow, with everything neatly arranged.

Even though I activated the logging at "debug" mode with metrics, I couldn't see the file in the folder /Appdata/Roaming/npm_cache/_logs.

My IT guy was on home office until yesterday, so I could not roll back the server. This is why I tried this other approach before. I am rolling it back 1 month now, and see how it fares. In any case, this is still an issue, because I tried the same old flow in a clean node-red install in my laptop and is still happening.

What I don't get is why the error. I am not using recursion, but iteration, and I clear the payload of all messages before sending them back to the input, so they should be always within the constraints of the maximum message.
I overwrite the global variables, not make new copies of them or nest the objects, so the variables should also have a limited size.
Unless node-red is creating new instances of the subflows on each iteration, CPU/Memory usage should be pretty stable.

Something is being called recursively somewhere. Which node in the new flow is it that throws the error?

[Edit] Or a function is being called with a massive amount of data being passed as parameters.

As I said, I do not call anything recursively. The only way that would happen is if when I loop back, new instances are created for each subflow. If the subflows only have a single instance for each time I place them in a flow, then it's just a mere iteration.

The messages are not specially big, and I make sure of clearing them before feeding them back into the FSM.

I did the roll back to the old version from a month ago. CPU usage after half an hour of running is between 0.1~0.5%, and stable. Last week it built up to 35-36% in 5 hours, then crashed.

It looks like it really has to do with some of the updates. My palette looks like this:

So one of these might be the culprit.

TBH, I avoid loops like the plague - they always bite.

I would use an scheduler (inject/cron) node that passes through a gate/control node (permitting the msg to travel if the flow is idle/not busy processing).


Also instead of the many global.get and global.set calls littered throughout your code, I would simply push the global object into msg.state at the beginning of the flow and pass it through the nodes, using it where required. e.g...


...at the end of the flow, call global.set (however, as the globals are objects, you dont really need to global.set since it is updated by reference automatically)


Also, I would ditch the FSM - as you have said, you have simplified states, so simplify (and rule out) the FSM node.


Also, you should fix up a couple of issues to rule them out first...

missing variable

not checking the status code

image
...if you get a bad response, you continue into a JSON node and function node - unexpected outcome is bound to occur

I didn't say you were, it wouldn't have to be an explicit call in a function, it could be in a node you have installed (or even in a core node). A loop in the node-red flow would not cause a recursive function call anyway.

Can you post the config of the AGV 58 CFG + STATUS node please.

Thanks a lot for the suggestions. Regarding them:

Regarding the loops, the application is a finite state machine. I need to loop back to feed the status into the machine. It is true that I could have an inject node going at intervals, but the main point of looping back is that I can control the timing of the loop.

For instance, when the AGV is offline I loop back after 5 seconds, when idle but not in a known position, I loop back after 3 seconds, but when docking, for instance, since I have to check the status for some sensors in the machine side, the loop is happening after one second.

Those delays are controlled by the trigger nodes in the transition subflow. Only one branch is active each iteration, and the trigger node only sends one reply, so it won't loop back unless the flow has finished doing its job.

Another option would be to have an inject node checking for a flag on each AGV object, then if the flag is on, start the flow, reset the flag, download the next state from the global variables, insert it into the FMS, and after it has processed the transition, set the next state and the flag again. This might work, but it is basically the same as a loop.

The problem with this approach is that I would need an inject node with a relatively short timing, like 500ms, to catch the flags when they come up, or I could miss some of them. Either case, it looks like checking the global variables so often would generate more CPU usage than just looping back when the node is finished and sends one message.

Regarding the global.get and global.set flags, you are right. I think I could download the current state as an object at the beginning of the transition state, work on it, then upload it at the end of the transition.I had a lot of problems with the old one, because after using a GET or POST would lose my payload and configuration info. In the new version, I use this message.agv to store the name of the AGV i refer to, and this allows me to download all the information from the global variables. I guess I can also store whatever I need outside of the payload, and that would not be affected by the node.

Regarding the missing variable: That is the from the old flow. I guess I missed that one on the new. Dangers of copy-pasting.

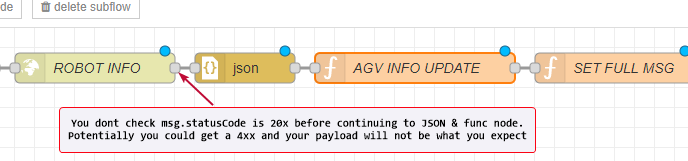
Checking the status code: That was on the to-do list, but not a critical issue. The robot server is dedicated for the AGVs fleet manager and nothing else, and unless the server is down (in which case nothing will work in the factory, because it means the server cluster is down), it will always reply.

If the robot is down, it will reply with a REGISTERED_OFFLINE status, which I already handle as an exception. If it's online, I'll have all the normal data. I can always throw in a switch node to interrupt the flow unless the statuscode is 20x, and maybe generate an error code in the global variables.

This was from the old flow. I used that Change node to set some configuration parameters on the message and update the FSM state of the AGV on the global variables (they were separate objects in the old one, in the new one, it's a single object)

The only way I can see that node generating the error would be if there were something very odd in msg.payload.status. Which node in the new flow was generating the error, if it was the same node each time?

[Edit] Corrected a typo in above, I meant to ask which flow in the new flow.

The only node before that is the subflow with the finite-statemachine node.

According to their documentation:

The payload contains:

  • status : Outputs the state of the FSM.
  • data : Outputs the data object of the FSM. Read more about the data object in the Usage Manual.

I don't use their data object because I had object nesting problems (on every iteration, it would insert the new data inside the previous data, and the msg.payload would grow). Therefore, my payloads are always a status string and an empty data object {}

Not sure about the new flow because I could not see the error message (on Windows I do not have the console, and if the error happens when the node-red editor is closed, I do not see any debug message). But the behaviour was exactly the same.

On the other hand, after the roll back, the old flow keeps running after more than two hours and CPU usage is still under 1%. Seems reasonable to think some of updates changed the behaviour of the nodes and broke the flow.

Update:
After 2 days of running the old flow and a week of running the new one, the CPU usage is still about 0,8% on the node-red server side.

Definitely looks like it was an update in one of the nodes that borked up the flow.

As pointed out, I'll start updating nodes one by one and see which one breaks it.

This topic was automatically closed 60 days after the last reply. New replies are no longer allowed.