I have had to rethink how to show this due to character limitations.
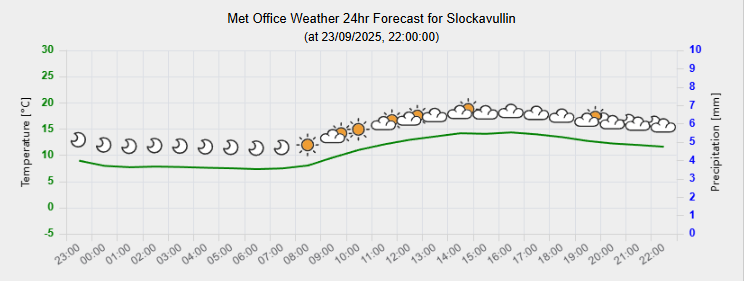
Some while ago someone published a weather flow with a very nice chart. I have recreated this chart as an echart. The chart is designed to work with data from the UK Met Office but the data requirements are simple and it should be easy to use other sources.
I am a newb with echarts so it would be very helpful if anyone has improvement ideas or other suggestions.
I have put put the chart up mainly as a basic example of using echarts. I have discovered some ideas from the (sometimes a bit obscure) documentation that I thought may interest others.
Basic settings to look like a ui_chart (The pre echart version)
Left & Right Y axis
Use of icons as line chart symbols
Tinkering with the tooltip
The chart, to be pasted into a ui_template node.
<template>
    <div class="base-container">
        <div class = "chart-title">{{chartTitle}} {{forecastLocation}}</div>
        <p class = "centre-text">(at {{runTime}})</p>
		<div class = "chart-container" ref = "echart" ></div>

	</div>

</template>

<script src="https://cdn.jsdelivr.net/npm/echarts/dist/echarts.min.js"></script>


<script>
    export default {
        data() {
            // define variables available component-wide
            // (in <template> and component functions)
            return {
                isChartLoaded: false,

				option: {},

				// Titles specific to this chart
				forecastLocation: '',
				runTime: '',

                /******** These properties can be dynamically edited ********
                 * Use msg.ui_update.<property name>
                */
                chartTitle: 'Met Office Weather 24hr Forecast for',

                // Note that these are the standard for my normal charts. Not used for this chart
                yAxisKey: 'value',                             	// String value - label, 'y' is the default
                xAxisKey: 'period',                            	// Number value - data,  'x' is the default
                seriesKey: 'attribute',                        	// '' is the default (none)

                yAxisLeftMin: -5,
                yAxisLeftMax: 30.0,

                yAxisRightMin: 0,
                yAxisRightMax: 10.0,

                yAxisLeftTitle: 'Temperature [°C]',
				yAxisRightTitle: 'Precipitation [mm]',
                xAxisTitle: '',

				/** ******************************************************/

                isLegendDisplay: false,

                textColour: 'black',
                gridColour: 'lightgrey',
                axisLabelColours: ['green', 'blue'],			// Colour of axis labels
                itemColours: ['green', 'blue'],					// Colour of lines & bars

            }

        },  // End of data


        watch: {
             msg: function () {
                if ( Object.hasOwn(this.msg, 'ui_update') ) {
					this.setDynamicProperties(this.msg.ui_update)

                }

                if (this.isChartLoaded) {
                    if (this.msg.payload !== undefined) this.onInput(this.msg.payload)

                }

            } // End of Function msg()

        }, // End of watch Section


        computed: {

        }, // End of computed Section


		methods: {
	  		draw () {
				/**
				 * Note: If this.$refs causes problems use this method of defining chart location in HTML
				 * const chartDom = document.getElementById('echart')
				 *
				 * Render chart using 'svg' rather than 'canvas'
				 */
				this.chart = echarts.init(this.$refs.echart, null, { renderer: 'svg' })

				this.setOption()

			}, // End Method draw()


            /**
			 * Description:	 Set all the options for the chart. Reload if any of the ui_update properties change
			 *
			 * @param	none
			 *
			*/
			setOption() {
				this.option = {
		  			tooltip: {
						trigger: 'axis',

						axisPointer: {
      						type: 'none',									// Other possible types are 'line', 'shadow' & 'cross'
      						snap: true,
    					},

					},

		  			legend: { show: this.isLegendDisplay },

		  			// The 'grid' determines how much of the 'canvas'(or SVG) is used by the chart
					// These values have been determined by experiment
		  			grid: {
						left: '0%',
						right: '0%',
						top: '2%',                                  		// Top reduced to allow for chart title
						bottom: '0%',

		  			},

  					yAxis: [
    					{
      						type: 'value',

							position: 'left',                             	// Y axis on 'left' or 'right'

      						name: this.yAxisLeftTitle,
      						nameLocation: 'middle',
    						nameTextStyle: {
      							color: this.textColour,
    						},

      						min:  this.yAxisLeftMin,
      						max:  this.yAxisLeftMax,
      						interval: 5,

      						axisLabel: {
								margin: 14,
								fontFamily: "Arial",
								fontWeight: 'bold',

								color: this.axisLabelColours[0],

        						formatter: '{value}'
      						},

							axisLine: {                                 	// The axis base line
			  					show: true,
								lineStyle: {
									color: this.gridColour,
								},
							},

							axisTick: {										// Ticks are the same colour as the axisLine
								show: true,
								length: 8,

							},

    					},

    					{
      						type: 'value',
							position: 'right',                             	// Y axis on 'left' or 'right'
      						name: this.yAxisRightTitle,
      						nameLocation: 'middle',
    						nameTextStyle: {
      							color: this.textColour,
    						},

      						min: this.yAxisRightMin,
      						max: this.yAxisRightMax,
							interval: 1,									// Show all integer values between min & max if possible

							// Do not show yAxis grid lines for the right hand axis
							splitLine: {									// What eCharts call the grid lines
								show: false,

							},

      						axisLabel: {
								margin: 14,
								fontFamily: "Arial",
								fontWeight: 'bold',

								color: this.axisLabelColours[1],

        						formatter: '{value}'

      						},

							axisTick: {										// Ticks are the same colour as the axisLine
								show: true,
								length: 8,

								lineStyle: {
									color: this.gridColour,
								},

							},

    					},

  					],

		  			xAxis: {
						type: 'category',

						/**
						 * Used if a label required for the x axis. Similar for the y axis
						 */
						name: this.xAxisTitle,
    					nameLocation: 'middle',
    					nameTextStyle: {
      						color: this.textColour,
    					},

    					// This is a label on the axis line
						axisPointer: {
							snap: true,
							label: {
        						show: false,								// Do not show label on axis line
        						// Format the tooltip first line.
								// Show the weather synopsis. Note: needs a local copy of the Array to work
								formatter: function(params) {
          										// The weather description is in the data of series 0
												return params.value + 'hrs ' +  params.seriesData[0].data.weather
        									},
      						},

      					},

						axisLine: {                                 		// The axis base line
			  				show: true,
							lineStyle: {
								color: this.gridColour,
							},

							onZero: false,									// The temperature y axis does not start at zero
																			// so move x axis baseline to bottom of chart

						},

						axisLabel: {
							margin: 14,
							fontFamily: "Arial",
							align: 'right',
							rotate: 35,
							formatter: '{value}',      						// Format the axis tick labels

						},

						axisTick: {											// Ticks are the same colour as the axisLine
							show: true,
							length: 8,

						},

						splitLine: {                                		// What eCharts call the grid lines
			  				show: true,

						},

						data: [],

		  			},

		  			series: [
						{
							name: 'Temperature',                  			// Used in the the 'tooltip'
							type: 'line',
							symbol: 'none',                     			// Shape of data point on graph
							animation: false,

							itemStyle: {									// Chart line colour
      							color: this.itemColours[0],

							},

      						tooltip: {
        						valueFormatter: function (value) {
          							return value.toFixed(1) + '°C'

        						}

							},

							data: [],

		  				},

    					{
      						name: 'Icons',                  				// Used in the the 'tooltip' if shown
      						type: 'line',
      						lineStyle: {
								opacity: 0									// Do not show line

							},

      						tooltip: {
        						show: false,								// Do not show tooltip

      						},

      						data: [],

    					},

    					{
      						name: 'Precipitation',                  		// Used in the the 'tooltip'
      						type: 'bar',
							animation: false,

      						yAxisIndex: 1,									// Let the 'series' know which y axis it is attached to. Defaults to 0

							itemStyle: {
								color: this.itemColours[1],					// Colour of bar
							},

      						tooltip: {
        						valueFormatter: function (value) {
          							return value + ' mm';
        						}
      						},

      						data: [],

    					}

					]
				}

				// Display the chart using the configuration items and data just specified
				this.updateChart()

	  		}, // End Method setOption()

            /**
			 * Description:	 If the chart is loaded initialise the chart data
			 *
			 * @param	{Object}	dataIn	- An Object containing 4 Arrays: labels[<numbers>], temperature[<numbers>], precipitation[<numbers>]
			 * 									and iconLine[{line: <number>, iconNumber: <number>, iconDescription: <string>}]
			 *
			*/
            onInput (dataIn) {
				// Check the input data. Data should be an Object of Arrays
                if (Array.isArray(dataIn.labels) && Array.isArray(dataIn.temperature) &&
					Array.isArray(dataIn.precipitation) && Array.isArray(dataIn.iconline) ) {

					// If there is only an empty Array clear the chart & exit (only check 1 Array)
                    if (dataIn.labels.length === 0) {
                        this.clearChart()

						this.send({clear: 'No Labels'})

                        return

                    } else {
                        // This chart widget has been designed for a specific data set
						this.clearChart()

                    	// Get chart title information
						this.forecastLocation = dataIn.forecastLocation
                    	this.runTime = dataIn.runDate

                        /** The data has format: labels[], temperature[], precipitation[] and iconLine[{line: value,
																									    iconNumber: Met Office icon number,
																									    iconDescription: weather synopsis}]
						*/
						// Copy input data into relevant 'data' Arrays in chart option
						this.option.xAxis.data = dataIn.labels

						//this.option.series[0].data = dataIn.temperature
						dataIn.temperature.forEach((element, index) => {this.option.series[0].data.push({value: element, weather: ''})})
						dataIn.iconline.forEach((element, index) => {this.option.series[1].data.push({value: element.line, ...this.addIcon(element.iconNumber)})
																	 // Because series 'Icons' is not shown it does not show in 'seriesData' of the xAxis formatter parameter
																	 this.option.series[0].data[index].weather = element.iconDescription
																	})

						this.option.series[2].data = dataIn.precipitation

						// Output the chart series data for retention
						//this.send({series: this.option.series})

						this.updateChart()

                    }

                } else {
					this.send({error: 'Data for chart Must be an Array', input: this.msg})

                }

            }, // End Method onInput()

            /**
			 * Description:	 Create an Object for data point symbol containing a UK Met Office weather icon URL
			 * 					and the symbol size. For use as point symbols
			 *
			 * @param	{number}	iconNumber	- Number of icon to add from Met Office weather icons
			 *
			*/
            addIcon(iconNumber) {
                const iconWeather = {
					symbolSize: 42,
					symbol: `image://https://www.metoffice.gov.uk/webfiles/latest/images/icons/weather/${iconNumber}.svg`
				}

				return iconWeather

            }, // End Method addIcon()

            /**
			 * Description:	 If the chart is loaded initialise the chart with the 'option' Object
			 *
			 * @param	none
			 *
			*/
            updateChart() {
               	if (this.isChartLoaded) {
                    this.chart.setOption(this.option)

                }

            }, // End Method updateChart()

            /**
			 * Description:	Clear the 'series' & x axis label data Arrays and reset to an empty chart
			 * 				 Note: this.updateChart() only does anything if the chart is already loaded
			 *
			 * @param	none
			 *
			*/
            clearChart() {
                if (this.isChartLoaded) {
                    this.option.series.forEach((series) => series.data = [])
					this.option.xAxis.data = []

                }

                //this.updateChart()

            }, // End Method clearChart()

            /**
			 * Description:	Update any dynamic properties exposed to ui_update in msg
			 *
			 * @param	{Object}	uiOptions	Properties & updated values from msg.ui_update
			 * 										example: {yAxisMax: 30}
			 *
			*/
			setDynamicProperties(uiOptions) {
                for (const [option, value] of Object.entries(uiOptions)) {
                    // Allow for invalid ui_update entries
					if (this[option] !== undefined) {
						this[option] = value

					}

				}

				this.setOption()

			}, // End Method setDynamicProperties()

        }, // End of methods


        /**
		* Description:	Actions to be taken when widget is first mounted
		*				 Wait until echarts library is loaded and then draw the chart and let the widget
		*				  know that echart is loaded
		*
		* @param	none
		*
		*/
		mounted() {
	  		let interval = setInterval(() => {
				if (window.echarts) {
					clearInterval(interval)

		  			this.draw()

					this.isChartLoaded = true

				}

	  		}, 25)

		}, // End of mounted


        unmounted() {
            // Code here when the component is removed from the Dashboard
            // i.e. when the user navigates away from the page

        } // End of unmounted

    }
</script>
The additional nodes with data to get the chart loaded, CSS and ui_update examples
[{"id":"f0143e5b3bf16400","type":"inject","z":"9fb2acebd1bf944c","g":"d49c0e77c8bdf353","name":"Test Data","props":[{"p":"payload"},{"p":"topic","vt":"str"}],"repeat":"","crontab":"","once":false,"onceDelay":0.1,"topic":"","payload":"{\t \"temperature\":[\t 11.45,\t 9.51,\t 7.97,\t 6.83,\t 6.18,\t 5.17,\t 4.33,\t 4.67,\t 4.62,\t 5.75,\t 5.87,\t 6.61,\t 7.12,\t 8.7,\t 9.79,\t 10.93,\t 11.56,\t 11.65,\t 12.2,\t 12.02,\t 12.29,\t 12.19,\t 12.13,\t 11.72\t ],\t \"precipitation\":[\t 0,\t 0,\t 0,\t 0,\t 0,\t 0,\t 0,\t 0,\t 0,\t 0,\t 0,\t 0,\t 6,\t 2,\t 0,\t 0,\t 0,\t 0.5,\t 0,\t 2.4,\t 0,\t 0,\t 0,\t 0\t ],\t \"windSpeed\":[\t 4.49,\t 3.18,\t 2.99,\t 2.33,\t 2.09,\t 1.47,\t 0.7,\t 0.57,\t 0.6,\t 0.89,\t 1.35,\t 1.22,\t 1.42,\t 2.27,\t 1.99,\t 2.52,\t 3.57,\t 4.35,\t 4.71,\t 4.67,\t 4.73,\t 4.48,\t 4.74,\t 3.81\t ],\t \"labels\":[\t \"19:00\",\t \"20:00\",\t \"21:00\",\t \"22:00\",\t \"23:00\",\t \"00:00\",\t \"01:00\",\t \"02:00\",\t \"03:00\",\t \"04:00\",\t \"05:00\",\t \"06:00\",\t \"07:00\",\t \"08:00\",\t \"09:00\",\t \"10:00\",\t \"11:00\",\t \"12:00\",\t \"13:00\",\t \"14:00\",\t \"15:00\",\t \"16:00\",\t \"17:00\",\t \"18:00\"\t ],\t \"iconline\":[\t {\t \"line\":15.45,\t \"iconNumber\":1,\t \"iconDescription\":\"Sunny Day\"\t },\t {\t \"line\":13.51,\t \"iconNumber\":0,\t \"iconDescription\":\"Clear Night\"\t },\t {\t \"line\":11.97,\t \"iconNumber\":0,\t \"iconDescription\":\"Clear Night\"\t },\t {\t \"line\":10.83,\t \"iconNumber\":0,\t \"iconDescription\":\"Clear Night\"\t },\t {\t \"line\":10.18,\t \"iconNumber\":0,\t \"iconDescription\":\"Clear Night\"\t },\t {\t \"line\":9.17,\t \"iconNumber\":0,\t \"iconDescription\":\"Clear Night\"\t },\t {\t \"line\":8.33,\t \"iconNumber\":0,\t \"iconDescription\":\"Clear Night\"\t },\t {\t \"line\":8.67,\t \"iconNumber\":0,\t \"iconDescription\":\"Clear Night\"\t },\t {\t \"line\":8.62,\t \"iconNumber\":2,\t \"iconDescription\":\"Partly Cloudy (Night)\"\t },\t {\t \"line\":9.75,\t \"iconNumber\":2,\t \"iconDescription\":\"Partly Cloudy (Night)\"\t },\t {\t \"line\":9.87,\t \"iconNumber\":2,\t \"iconDescription\":\"Partly Cloudy (Night)\"\t },\t {\t \"line\":10.61,\t \"iconNumber\":7,\t \"iconDescription\":\"Cloudy\"\t },\t {\t \"line\":11.12,\t \"iconNumber\":7,\t \"iconDescription\":\"Cloudy\"\t },\t {\t \"line\":12.7,\t \"iconNumber\":7,\t \"iconDescription\":\"Cloudy\"\t },\t {\t \"line\":13.79,\t \"iconNumber\":7,\t \"iconDescription\":\"Cloudy\"\t },\t {\t \"line\":14.93,\t \"iconNumber\":7,\t \"iconDescription\":\"Cloudy\"\t },\t {\t \"line\":15.56,\t \"iconNumber\":7,\t \"iconDescription\":\"Cloudy\"\t },\t {\t \"line\":15.65,\t \"iconNumber\":7,\t \"iconDescription\":\"Cloudy\"\t },\t {\t \"line\":16.2,\t \"iconNumber\":8,\t \"iconDescription\":\"Overcast\"\t },\t {\t \"line\":16.02,\t \"iconNumber\":7,\t \"iconDescription\":\"Cloudy\"\t },\t {\t \"line\":16.29,\t \"iconNumber\":8,\t \"iconDescription\":\"Overcast\"\t },\t {\t \"line\":16.19,\t \"iconNumber\":8,\t \"iconDescription\":\"Overcast\"\t },\t {\t \"line\":16.13,\t \"iconNumber\":8,\t \"iconDescription\":\"Overcast\"\t },\t {\t \"line\":15.72,\t \"iconNumber\":8,\t \"iconDescription\":\"Overcast\"\t }\t ],\t \"forecastLocation\":\"Slockavullin\",\t \"runDate\":\"21/09/2025, 18:00:00\"\t}","payloadType":"jsonata","x":940,"y":1560,"wires":[["925dd013b74d1c85"]]},{"id":"a380bd05bbd478e6","type":"inject","z":"9fb2acebd1bf944c","g":"d49c0e77c8bdf353","name":"ui_update Examples","props":[{"p":"ui_update","v":"{\"chartTitle\":\"A New Title\",\"yAxisLeftMin\":-10,\"yAxisLeftMax\":35,\"yAxisRightMin\":4,\"yAxisRightMax\":12,\"yAxisRightTitle\":\"Go For It\",\"yAxisLeftTitle\":\"Nothing To Loose\",\"xAxisTitle\":\"Whoo Hoo\"}","vt":"json"}],"repeat":"","crontab":"","once":false,"onceDelay":0.1,"topic":"","x":970,"y":1600,"wires":[["925dd013b74d1c85"]],"info":" chartTitle: 'Met Office Weather 24hr Forecast for',\r\n\r\n // Note that these are the standard for my normal charts. Not used for this chart\r\n yAxisKey: 'value', \t// String value - label, 'y' is the default\r\n xAxisKey: 'period', \t// Number value - data, 'x' is the default\r\n seriesKey: 'attribute', \t// '' is the default (none)\r\n\r\n yAxisLeftMin: -5,\r\n yAxisLeftMax: 30.0,\r\n\r\n yAxisRightMin: 0,\r\n yAxisRightMax: 10.0,\r\n\r\n yAxisLeftTitle: 'Temperature [°C]',\r\n\t\t\t\tyAxisRightTitle: 'Rainfall [mm]',\r\n xAxisTitle: '',"},{"id":"6def13f2ee0268c4","type":"ui-template","z":"9fb2acebd1bf944c","g":"d49c0e77c8bdf353","group":"","page":"58460408075ccca5","ui":"","name":"Weather CSS","order":0,"width":0,"height":0,"head":"","format":" .chart-title{\n text-align: center;\n\t\tfont-size: 1.0em;\n\n }\n\n .centre-text {\n text-align: center;\n font-size: 0.8rem; \n }\n\n\t.base-container {\n \twidth: 100%;\n \theight: 100%;\n \tjustify-content: center;\n \talign-items: center;\n \tcontainer: chat / size; /* make this container available for container querys*/\n \n\t}\n\n\t.chart-container {\n \tposition: relative;\n \tmargin: auto;\n \theight: 86cqb; /* use container query units to give full height of the container (95% of container height) \n to allow for title */\n \twidth: 100cqi; /* use container query units to give full width of the container (100% of container height)*/\n \tdisplay: flex;\n \tjustify-content: center;\n \talign-items: center;\n\t}","storeOutMessages":true,"passthru":true,"resendOnRefresh":true,"templateScope":"page:style","className":"","x":1320,"y":1540,"wires":[[]]},{"id":"58460408075ccca5","type":"ui-page","name":"Weather Forecast","ui":"80f2e5f9dbf80780","path":"/Weather_Forecast","icon":"home","layout":"grid","theme":"a5bbf4397c8aa75a","breakpoints":[{"name":"Default","px":"0","cols":"3"},{"name":"Tablet","px":"576","cols":"6"},{"name":"Small Desktop","px":"768","cols":"9"},{"name":"Desktop","px":"1024","cols":"12"}],"order":1,"className":"","visible":"true","disabled":"false"},{"id":"80f2e5f9dbf80780","type":"ui-base","name":"Environment","path":"/dashboard","appIcon":"","includeClientData":true,"acceptsClientConfig":["ui-notification","ui-control"],"showPathInSidebar":false,"headerContent":"page","navigationStyle":"default","titleBarStyle":"default","showReconnectNotification":true,"notificationDisplayTime":5,"showDisconnectNotification":true,"allowInstall":true},{"id":"a5bbf4397c8aa75a","type":"ui-theme","name":"Default Theme","colors":{"surface":"#ffffff","primary":"#0094ce","bgPage":"#ffffff","groupBg":"#eeeeee","groupOutline":"#cccccc"},"sizes":{"pagePadding":"12px","groupGap":"6px","groupBorderRadius":"5px","widgetGap":"12px","density":"default"}},{"id":"022be6ec86255446","type":"global-config","env":[],"modules":{"@flowfuse/node-red-dashboard":"1.27.2"}}]
I have had to do it this way to keep under the character limitations of a post.