Right click, but since the status shows off its on or off, a simple click would work.
Anyway, I'm not developing this node and I have no expectation that anyone else will.
Just pondering alternatives.
Right click, but since the status shows off its on or off, a simple click would work.
Anyway, I'm not developing this node and I have no expectation that anyone else will.
Just pondering alternatives.
logIO version 1.2.0 released: node-red-log-io (node) - Node-RED
Sorry for slow reply - personally I find that even worse than the overlayed button/port. But yeah - it's not about me ![]()
(but the hiding is good so not too intrusive)
I like this direction for Node-Red. Spent a bit of time with https://nifi.apache.org/ and liked some of the cross-cutting flow control and audit concerns it takes seriously and factors into pluggable repositories...Apache NiFi Overview
Is any of this "pass-through debug" / "test point" stuff likely to be implemented for Node-red 5.0?
I really hope so. And I hope it solves the multiple editors issue (ref)
The message tracer over in the introspection package does work well enough for me - just saying if you want debug a) without deploying b) without adding debug nodes.
In Erlang-Red I even added to the right button menu because the sidebar was too much work:
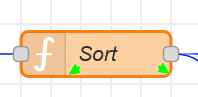
The node gets a green dot that can be used to deactivate the debugging again:
Debugging multiple nodes at one time is possible.
The debugging node is an essential part of node-red. It supports the culture behind node-red. Start, check the output, add another node to modify the output, improve step by step. Over the development of a flow I usually start to remove debug nodes to pretty things up, move the nodes closer to keep things visible on the screen. So far so good.
But half a year later I need to change something because there is a new device and then I need to add all the debug stuff again etc etc. I'm, coming from electronics, where you have test points on the circuit board. A debug node which hands the signal/message through seems a very logical thing to mee. And it would fit with the step-by-step development node-red supports.
I recently played a little bit with n8n. They use a different approach. The output of a 'node' can be seen when you click on it. It is part of the configuration window. I prefer the node-red way.
Quick note, I am going to try to build something that does a through debug. May call it through-bug. ![]()
Just a simple experiment for now to see how useful it might be.
I am thinking of a debug handling process allowing each node in a flow to have a virtual debug node connected, both at the input and output connector.
I'm sure there's nothing novel here but I have not seen the approach discussed in any detail.
{"input": false, "output": true}.Debug Handler. This would hold a switch true/false and some debug handling code (see later).Change the core message passing code (I have no idea how Node-red does this, in particular how it handles passing a message to a node and then receiving it back for passing on down the line).
This has a minimum processing overhead of two tests of the global debug handler switch, held in memory and set at deploy.
When passing a message,
IF the global Debug Handler === `true`
    IF (msg._debug.input === `true`)
        Pass the message, target node id and flow id(?) to the Debug Handler.
Pass the message to the target node as now.
After processing
IF the global Debug Handler === `true`
    IF (msg._debug.output === `true`)
        Pass message, just executed node id and flow id(?) to the Debug Handler.
Continue normal processing
This might be called up to twice for each node in a flow, before the node is executed and after it completes. But only if debug is turned on globally, and for the node itself.
A minimal debug handler would output the message to the debug panel, if debug is turned on for this flow, cf the current debug node set to "Complete message object".
The code to achieve this is provided by default in the Debug Handler config node.
It could do more though, the user might change the code to
We would need a way to turn input and output flags on and off for each node.
Could the core node-config and flow config dialogs be amended to do this without needing to modify individual core and contrib nodes? (where to save the flags?)
Possibilities? Sorry, ugly arrows.


That's well said and I don't see the Node-RED culture as being a "developer culture" rather a "put something together and it works" culture. Node-RED target audience isn't developers and that's a pity.
Hence this discussion on debug nodes - there shouldn't be any debug nodes. Just as a programming language does not have "debug code". You use a debugger for that.
This is where developers and Node-RED users differ: as a developer I want to be able to debug a running system and not redeploy and check what's going on. I can't be restarting production systems just because I forgot to add a debug node somewhere.
Hence why not just improve the "debugger package" to make debugging live systems simpler. Without having to deploy all the time. Its hard to unlearn this "add a debug node, redeploy and hope". Hope that the error happens again. But that's what I'm trying to do. Its far more efficient and makes for simpler flows, i.e. no debug nodes all over the place.
The deactive bug on a debug node is a symptom for "well I added a debug, and I might need again, but I'm not sure because I don't really know what's going on". So I turn it off. But perhaps it should be on again. Oh, too late, bug just happened.
Debug nodes tend not to be removed. Hence the cluttering up flows. Hence making the minification of nodes, especially debug nodes. All a kind of "hack" around the actual problem that it is hard to debug a live node red flow.
Urgh! You've not seen my code then! ![]()
Of course, any production environment would be working on test and dev environments for debugging anyway. ![]()
Possibly because "debugging" in node-red is not just debugging the system but also debugging a flow. And these are, of course, two completely different things.
The debugger can be useful for debugging the system (though even there, I would argue that log outputs are also critical to debugging complex systems like Node-RED) but are really not useful for debugging flows.
Really, the debug node probably should have been called the print or output node. Since that is really what it does. It lets us monitor what is happening to the FLOWs rather than the SYSTEM.
Thanks for capturing my sentiment. Code has debug code but it doesn’t have a debug command was what I meant. We build debug code from print statements and don’t have debug(…) inbuilt command in the language.
Calling debug node the print node would clarify that. Or perhaps call it “outject” as counterpoint to inject. After all both nodes only function when the editor is connected to the server.
I see using a debug as a kind of code smell but introspecting/analysing a system a good way to understand the system.
Working name for my experimental node is:
threw-out
![]()
If you want to try it out, please install my testbed from GitHub.
cd ~/.node-red
npm install totallyinformation/Node-RED-Testbed
It doesn't do a lot right now but if you turn on the checkbox, it will output any input message (in full up to the debug msg length limit) to the debug panel.
After doing that I don't see a threw-out node.
The startup log gives me this (might have already been there!)
18 Jul 17:28:24 - [info] Loading palette nodes
TypeError [ERR_INVALID_ARG_TYPE]: The "path" argument must be of type string. Received undefined
    at Object.dirname (node:path:1384:5)
    at loadNodeLocales (/usr/lib/node_modules/node-red/node_modules/@node-red/registry/lib/loader.js:234:35)
    at loadPluginConfig (/usr/lib/node_modules/node-red/node_modules/@node-red/registry/lib/loader.js:331:11)
    at loadModuleTypeFiles (/usr/lib/node_modules/node-red/node_modules/@node-red/registry/lib/loader.js:83:31)
    at loadModuleFiles (/usr/lib/node_modules/node-red/node_modules/@node-red/registry/lib/loader.js:122:60)
    at load (/usr/lib/node_modules/node-red/node_modules/@node-red/registry/lib/loader.js:43:12)
    at process.processTicksAndRejections (node:internal/process/task_queues:105:5) {
  code: 'ERR_INVALID_ARG_TYPE'
}
⚙️ [nr-class:NrNode:constructor] >> dummy-do-not-use
⚙️ [ti-class:constructor] >> ti-class
⚙️ [nr-class:NrNode:start] >> ti-class
Oops, my bad! That only works if you have the manual node-red bug fix I identified earlier! Sorry about that. Let me fix it and I'll update.
What if we could enable debugging in a node instead of having a node for debugging?
When a node has debugging configured, Node-RED core will pass log the output before sending the message forward
Done! If you reinstall, it should work.
Please note that the various advanced settings don't yet work. You will always get the full msg output at present. I'll fix that at some point soon.
I got myself sidetracked by trying to make the default node setting not to show the label. But it seems this isn't possible! There is some secret magic that lets the link nodes default to not showing labels but we mere pleb's aren't allowed to do it. ![]()
Personally, I think I would end up getting in a complete mess with that. "Darn it, which nodes did I turn debugging on for?!" - I prefer to see a node.
The ones that have the new icon or some other UI feature that makes it very clear for the User that debugging is enabled for that node.
Copyright OpenJS Foundation and Node-RED contributors. All rights reserved. The OpenJS Foundation has registered trademarks and uses trademarks. For a list of trademarks of the OpenJS Foundation, please see our Trademark Policy and Trademark List. Trademarks and logos not indicated on the list of OpenJS Foundation trademarks are trademarks™ or registered® trademarks of their respective holders. Use of them does not imply any affiliation with or endorsement by them.
The OpenJS Foundation | Terms of Use | Privacy Policy | OpenJS Foundation Bylaws | Trademark Policy | Trademark List | Cookie Policy


