I made a suggestion around that earlier today, don't know if anyone noticed?
Yes. Just read your comment. It is the same solution.
In my opinion, fully coloring the input or output ports using a color different than the default is enough to show Users that the node is going to log messages when something passes through the node.
I liked your third suggestion. The one that you placed a green square inside the ports. But I believe it would look better if it was fully colored with green, while making the border a darker green.
Agreed. Limitations of my image editor!
The idea is if the input debug is switched on, fill the input connector.
If output, likewise.
Doesn’t this then “compete” with the other request to be able to tell when wires are connected , rather than passing underneath, which is also currently being looked at by differentiating the connector pins
Yes it does ![]()
You are considering changing the connector fill colour when a wire is connected?
For sure there is a problem, where nodes overlay wires but are not connected, which ought to be tackled. Currently you have to move the node and watch the wires.
Changing the node fill won't help in the following situation though, you have to look at the wires.
So 95% + of connectors change colour and the issue is only resolved where zero wires are attached.
Changing the colour of a connector if no wire is connected?
Much less frequent, possibly a brighter fill (red)? in the rare occurrence.
I think this could co-exist with the "debug turned on" option, no wire connected takes precendence.
Edit - that would work for the input connector but not really for the output, where no wire connected is a viable setting.
Could one or other indication employ an outer glow, or a drop shadow effect?
Only indicate no wires on an input connector?
I bow to your knowledge and guardianship of the user interface look!
I'm just throwing up the outline of an idea to see if people like it.
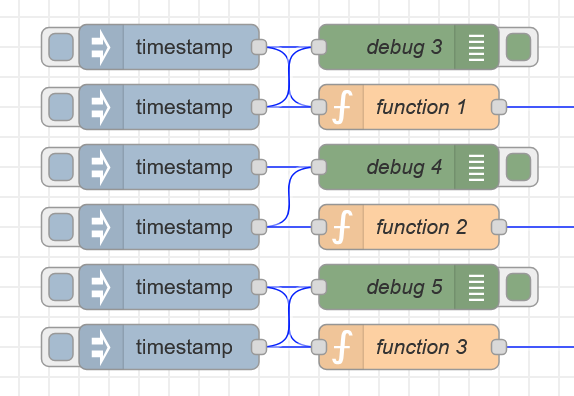
I've updated and committed an improved version. I think everything should work pretty much as the debug node does. Except that the default for status output is count rather than the same as the debug output since that's what I mostly use it for. ![]()
Because we don't have the output button to indicate whether output is active or not, I've added a visual indicator to the label. Simply turn off all three possible outputs and the node will just pass messages straight through.


If I get 10 more subscriptions to my YouTube channel
, I'll publish this as a separate node. ![]()
I might even do it if I get a few responses on this thread asking me to.
Otherwise, it might one day be added to UIBUILDER.
It installs ok now. ![]()
-
Sometimes it doesn't work. If I untick all the outputs & deploy, then tick Debug WIndow & deploy, it does not output messages. (I have it set to complete message object)
-
Double click the node to open the config dialog. Cancel. Click somewhere else. The node label disappears. Sometimes happens when you drag the node too.
-
Although Node Status is not ticked, there is a blue dot and 0 below the node. It does not update as messages pass through.
-
I find it hard to associate the active/inactive indicator with an output. Partly because outputs are at the right and this is at the left. No doubt also because I'm used to the debug node "button" collapsing.
This is pretty good, worth adding to the palette but I don't think it will replace my use of the debug node until I can turn off it's output with a single click.
Thanks for the unreserved praise! ![]()
Mostly it is a copy/paste from the debug node but I did spot some odd things in the code that probably need simplifying. I didn't really have much time or energy to do that I'm afraid.
If a few more people think it worth turning into a full node, I'll probably go and dig some more. Otherwise, I doubt I'll do much more on it.
Honestly the more I think about this redesign the more I realize dedicated debug nodes are unnecessary overhead. In my opinion at least.
Most of the time I use them to inspect complete message objects to see what my flows are doing. That means I have to clutter my flows with debug nodes, set them to print the whole msg object, wire them up, work on my flows, etc., then after I'm finished I need to clean up the mess I created. And when I need to debug something again months later, I need to do this all over again.
Since wires are responsible for passing messages around, and I'm interested in complete msg objects, I think it would simplify flow debugging A LOT if the wires themselves had a debug toggle. That's it. No need to place new nodes, wire them up, clean up afterwards, etc. Simply toggle individual wires' debug property. They could have a different color or whatever.
I'm sure you use debug nodes for more advanced stuff, and I would not replace the existing system, but at the same time I think some simple wire debugging I described would be sufficient for a lot of users and their needs.
That is an interesting idea. Likely to be best as part of a design enhancement for wires though? Perhaps to include some of the other things asked for over the years?
Yes - it would be a fairly fundamental change as currently wires do not have properties. Wires are in fact properties of a node... so yes would be a big breaking change to the flow file.
If you're more interested in inspecting that have a look at the message tracer feature of the introspection package.
I don't quite understand what the debate is about. Just having a message tracer in the sidebar is - for me - a perfect solution. Switch it on, see messages, switch it off - done. No deploy, no restart, no fuss.
The only thing that might be improved is which messages are traced - incoming or outgoing, because tracing is done on nodes not wires.
I don't think wires should have any special debug abilities.
The most elegant solution is, i think, @dceejay's idea of "test points". This could be implemented as an extension of the currently vestigial junction node.
A "debug" flag in the config. and a coloured fill if its set to output (the complete message?) to debug.
Turning debug on/off would be via the config or right click.

Thanks for the heads up, at least it’s a clear failure report ![]() - i think i know why …
- i think i know why …
I’ll have a look asap…
Since node-red uses the word "wire" to refer to connections, I propose using the word "debug clamp" for adding debug capabilities to wires because it kind reminds me of why I use an amp clamp. When I want to check if there is energy flowing (messages) through wires, and how much it is handling (message details), I use an amp clamp

- A debug clamp doesnt need a redeploy.
- You can sub/unsub to debug wire topics on need.
- Debug topics are created for every wire during deploy.
- When an debug clamp is added to a wire, the wire changes its color, or a ring is drawn around it.
That node no longer exists, it's the white on white node. I used to have a screenshot node before I learnt what plugin nodes are. That was my first package and had a lot of learnings unfortunately one learning was not to update documentation!
Love it ![]() - perfect analogy for visual programming
- perfect analogy for visual programming
Click the Clamp button, mouse becomes a clamp icon, move mouse over wire, wire is highlighted, click and hold on wire, the clamp is locked on the wire. Messages shown. Release mouse button, display is gone.
It's on my mental todo-list ![]()
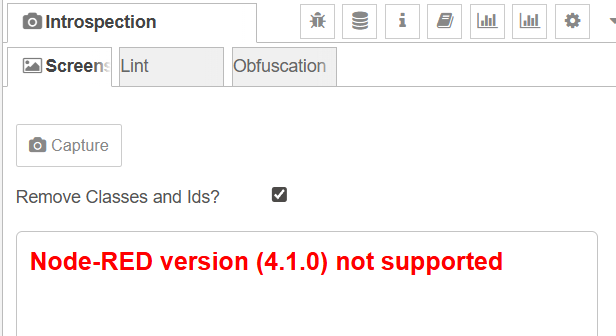
Thanks again for the heads up, is now fixed with 0.11.0 ![]() - I did test it on 4.1.0-22!
- I did test it on 4.1.0-22!