Uibuilder vega chart and db-s integration

Hi,

I've started to experiment with uibuilder and Vue, and I'm having problems integrating Vega charts to the uibuilder.

Here are the files (modified from Julian's charting examples):
flows (84).json (16.0 KB)

Unfortunately, I can't make heads or tales with this vega charts integration - can anyone help me out?
I've also placed the standard dashboard vega flow - which I am trying to integrate into uibuilder.

To be honest, I don't undestand how the other charts (from Julian's example) were run. Couldn't find any function which runs them (besides onload which is obviously used for dynamic input).

  1. I have placed the data property into the vega spec itself just to test out the vega first - but I dont know where to put the spec variable.
  2. Also, I'm not sure how to start vegaEmbed function from HTML file using script tags - nothing is the same as the dashboard.

Unfortunately I'm am not a dev by profession, so this is my way to adjust to the new programming enviroment.
I've seen the basics of Vue on thenetninjas channel on yt, but I don't know how to use it practically with charts and databases...

Also, does anyone have some examples how to use databases (sqlite with uibuilder and vue)?
I dont know if one should write everything in Vue CLI or use node-red as before only with minor help of a single uibuilder node?

Hi, helps if you share your front-end code rather than just the flow. A picture of the flow can help as well as most of us don't really want to keep loading random flows.

The reason you don't see something explicit starting the charts is that they are configured to auto-run when loaded via a script link. Most front-end libraries do, including the uibuilder front-end. Though you have to run the start function (for reasons explained in the docs), the uibuilder object is auto-created for you. Same with VueJS, etc.

Remember that uibuilder doesn't require you to use a front-end library. So the best place to start is to start with the blank template, cut the html file down to a minimum and then add a vega example from their website.

Then you can work out what format of data it needs and then you can send that from Node-RED via the uibuilder node.

Once you have the basics working, you can add VueJS or something else if you want the reactivity.

1 Like

Ok I'll try without Vue and get back to you.
Anyway, here are the files:

html:

<!doctype html><html lang="en"><head>
    <meta charset="utf-8">
    <meta http-equiv="X-UA-Compatible" content="IE=edge">
    <meta name="viewport" content="width=device-width, minimum-scale=1, initial-scale=1, user-scalable=yes">

    <title>Vega charts Example - Node-RED UI Builder</title>
    <meta name="description" content="Node-RED UI Builder - Vega chart Example">

    <link rel="icon" href="./images/node-blue.ico">

    <link type="text/css" rel="stylesheet" href="../uibuilder/vendor/bootstrap/dist/css/bootstrap.min.css" />
    <link type="text/css" rel="stylesheet" href="../uibuilder/vendor/bootstrap-vue/dist/bootstrap-vue.css" />

    <link rel="stylesheet" href="./index.css" media="all">
</head><body>
    <div id="app">
        <b-container id="app_container">

            <h1>
                Example of using Vega charts with uibuilder, VueJS and bootstrap-vue
            </h1>

            <b-row>
                <div id="vis1" style="height:500px"></div>
                <script>


                    vegaEmbed("#vis1", spec, {"actions": false}).then(result => console.log(result)).catch(console.warn);

                </script>
                </div>
            <!-- 
                <b-card cols="5" class="mr-1" header="Bar Chart" border-variant="primary" header-bg-variant="primary" header-text-variant="white" align="center">
                    <column-chart :data="[['Sun', 32], ['Mon', 46], ['Tue', 28]]"></column-chart>
                </b-card>

                <b-card  class="mr-1" header="Line Chart" border-variant="primary" header-bg-variant="primary" header-text-variant="white" align="center">
                    <line-chart :data="lineChartData"></line-chart>
                </b-card>

                <b-card  class="mr-1" header="Multi-Series Line Chart" border-variant="primary" header-bg-variant="primary" header-text-variant="white" align="center">
                    <line-chart :data="lineChartData2"></line-chart>
                </b-card>

                <b-card class="w-100 mt-3 mb-3" header="Area Chart" border-variant="primary" header-bg-variant="primary" header-text-variant="white" align="center">
                    <area-chart :data="areaChartData"></area-chart>
                </b-card>

                <b-card class="mr-1" header="Geo Chart (Google)" border-variant="primary" header-bg-variant="primary" header-text-variant="white" align="center">
                    <geo-chart width="800px" :data="[['United States', 44], ['Germany', 23], ['Brazil', 22]]"></geo-chart>
                </b-card>

                <b-card class="mr-1" header="Timeline (Google)" border-variant="primary" header-bg-variant="primary" header-text-variant="white" align="center">
                   <timeline width="800px" :data="[['Washington', '1789-04-29', '1797-03-03'], ['Adams', '1797-03-03', '1801-03-03']]"></timeline>
                </b-card>
            -->
            </b-row>

        </b-container>
    </div>

    <script src="../uibuilder/vendor/socket.io/socket.io.js"></script>
    <script src="../uibuilder/vendor/vue/dist/vue.min.js"></script>
    <script src="../uibuilder/vendor/bootstrap-vue/dist/bootstrap-vue.js"></script>

    <!-- Loading from CDN, use uibuilder to install packages and change to vendor links -->
    <!-- <script src="https://unpkg.com/chart.js@2.8.0/dist/Chart.bundle.js"></script> Chart.js -->
    <!-- <script src="https://www.gstatic.com/charts/loader.js"></script> Google Charts -->
    <!-- <script src="https://code.highcharts.com/highcharts.js"></script> HighCharts -->
    <!-- <script src="https://unpkg.com/vue-chartkick@0.5.1"></script> -->
    <script src="https://cdn.jsdelivr.net/npm/vega@5"></script>
	<script src="https://cdn.jsdelivr.net/npm/vega-embed@6"></script>

    <script src="./uibuilderfe.min.js"></script> <!--    //prod version -->
    <script src="./index.js"></script>

</body></html>

js:

/* jshint browser: true, esversion: 5 */

/* globals document,Vue,window,uibuilder */

// @ts-nocheck

/*

  Copyright (c) 2019 Julian Knight (Totally Information)

  Licensed under the Apache License, Version 2.0 (the "License");

  you may not use this file except in compliance with the License.

  You may obtain a copy of the License at

  http://www.apache.org/licenses/LICENSE-2.0

  Unless required by applicable law or agreed to in writing, software

  distributed under the License is distributed on an "AS IS" BASIS,

  WITHOUT WARRANTIES OR CONDITIONS OF ANY KIND, either express or implied.

  See the License for the specific language governing permissions and

  limitations under the License.

*/

'use strict'

/** @see https://github.com/TotallyInformation/node-red-contrib-uibuilder/wiki/Front-End-Library---available-properties-and-methods */

// eslint-disable-next-line no-unused-vars

var app1 = new Vue({

    el: '#app',

    spec :

    {

        "description": "A basic bar chart example, with value labels shown upon mouse hover.",

        "width": 400,

        "height": 200,

        "padding": 5,


        "data": [

          {

            "name": "table",

            "values": [

              {"category": "A", "amount": 28},

              {"category": "B", "amount": 55},

              {"category": "C", "amount": 43},

              {"category": "D", "amount": 91},

              {"category": "E", "amount": 81},

              {"category": "F", "amount": 53},

              {"category": "G", "amount": 19},

              {"category": "H", "amount": 87}

            ]

          }

        ],


        "signals": [

          {

            "name": "tooltip",

            "value": {},

            "on": [

              {"events": "rect:mouseover", "update": "datum"},

              {"events": "rect:mouseout",  "update": "{}"}

            ]

          }

        ],


        "scales": [

          {

            "name": "xscale",

            "type": "band",

            "domain": {"data": "table", "field": "category"},

            "range": "width",

            "padding": 0.05,

            "round": true

          },

          {

            "name": "yscale",

            "domain": {"data": "table", "field": "amount"},

            "nice": true,

            "range": "height"

          }

        ],


        "axes": [

          { "orient": "bottom", "scale": "xscale" },

          { "orient": "left", "scale": "yscale" }

        ],


        "marks": [

          {

            "type": "rect",

            "from": {"data":"table"},

            "encode": {

              "enter": {

                "x": {"scale": "xscale", "field": "category"},

                "width": {"scale": "xscale", "band": 1},

                "y": {"scale": "yscale", "field": "amount"},

                "y2": {"scale": "yscale", "value": 0}

              },

              "update": {

                "fill": {"value": "steelblue"}

              },

              "hover": {

                "fill": {"value": "red"}

              }

            }

          },

          {

            "type": "text",

            "encode": {

              "enter": {

                "align": {"value": "center"},

                "baseline": {"value": "bottom"},

                "fill": {"value": "#333"}

              },

              "update": {

                "x": {"scale": "xscale", "signal": "tooltip.category", "band": 0.5},

                "y": {"scale": "yscale", "signal": "tooltip.amount", "offset": -2},

                "text": {"signal": "tooltip.amount"},

                "fillOpacity": [

                  {"test": "datum === tooltip", "value": 0},

                  {"value": 1}

                ]

              }

            }

          }

        ]

      },


    data: {

        // Single series line chart

        lineChartData: [

            ['Jan', 4], ['Feb', 2], ['Mar', 10], ['Apr', 5], ['May', 3],

        ],

        // Multi-series line chart

        lineChartData2: [

            {name: 'Workout', data: {'2017-01-01 00:00:00 -0800': 3, '2017-01-02 00:00:00 -0800': 4}},

            {name: 'Call parents', data: {'2017-01-01 00:00:00 -0800': 5, '2017-01-02 00:00:00 -0800': 3}},

        ],

        // Area chart

        areaChartData: [], //{

            //'2017-01-01 00:00:00 -0800': 2,

            //'2017-01-01 00:01:00 -0800': 5,

        //},


    }, // --- End of data --- //

    computed: {

    }, // --- End of computed --- //

    methods: {

    }, // --- End of methods --- //

    // Available hooks: init,mounted,updated,destroyed

    mounted: function(){

        /** **REQUIRED** Start uibuilder comms with Node-RED @since v2.0.0-dev3

         * Pass the namespace and ioPath variables if hosting page is not in the instance root folder

         * e.g. If you get continual `uibuilderfe:ioSetup: SOCKET CONNECT ERROR` error messages.

         * e.g. uibuilder.start('/nr/uib', '/nr/uibuilder/vendor/socket.io') // change to use your paths/names

         */

        uibuilder.start()

        var vueApp = this

        // Process new messages from Node-RED

        uibuilder.onChange('msg', function (newVal) {

            // We are assuming that msg.payload is an array like [datenum, value]

            // Add new element

            vueApp.areaChartData.push( new Array( (new Date(newVal.payload[0])), newVal.payload[1] ) )

            // If data array > 1000 points, keep it at that length by losing the first point

            if ( vueApp.areaChartData.length > 10 ) vueApp.areaChartData.shift()

            //console.log(vueApp.areaChartData)

        })

    } // --- End of mounted hook --- //

}) // --- End of app1 --- //

// EOF

flow picture:
image

OK, finally I'm back to this project and I was able to load the charts only with basic html and JS which had vega object and loader.

Next: dynamic input and then DB - so perhaps I will need more help,

1 Like

OK, now I have ALOT more questions. Seems like I'm at the start of the uibuilder+Vue.JS learning curve.
From my perpective, transition from the dashboard to uibuilder with a front-end framework is tough.

Let me explain what I'm trying to achieve:
A "simple" flow which uses a button which when pressed loads new random data into vega charts and exports the chart data out of the uibuilder node to the db every 5 mins. Is this the way to go?
I try to pursue the Vue approach because all the charting examples are made with Vue, and because this is my ultimate goal. (I've added some 8 example flows but I still don't understand)

What I have made so far:
I have managed to get the static chart to show by avoiding the Vue.JS, and putting the spec object and the vegaEmbed in the index.js file (only this is in it, nothing else). html file contains this line <div id="vis1" style="height:500px"></div> which is the container where the charts are shown.

Now for the questions:

  1. I've been following the Vue tutorial for beginners and don't undestand why do the use
const app = Vue.createApp({
  data() {
...
  }
})

app.mount('#app')

and all the examples for the uibuilder use:

const app = new Vue({
    el: '#app',

    data() {

whats the difference?

  1. Do I need to use this kind of tags to call the charts? <apexchart width="100%" type="donut" :options="doptions" :series="dseries"></apexchart>
    I noticed this libraries have a component for Vue ready and the correct way to use it by calling it in the JS file like this?
/** Reference the apexchart component (removes need for a build step) */
Vue.component('apexchart', VueApexCharts)

How is this applicable to the vega charts? Which one do I need to look for, Vega or VegaEmbed?
some links:

I'm not sure these are 100% functional, as I don't use the classic 'premade' charts but instead a multi axis multi type timeline charts...

  1. And while we're at the apexchart example, how to get familiar with this?
    JS:
        // Data for donut chart
        doptions: {},
        dseries: [44, 55, 41, 17, 15]
...
        uibuilder.onChange('msg', function (newVal) {
            if ( typeof newVal.payload === 'number' ){
                // Add new element
                vueApp.dseries.push(newVal.payload)
                // Lose the first element
                vueApp.dseries.shift()
                //console.log(vueApp.dseries)
            }
        })

How does this work? I don't understand..........

It can be if you aren't familiar with web development, there are a lot of things to learn.

The main thing to remember is that uibuilder iteself is very simple to use. But it's main purpose is to act as a link between the data you throw about in Node-RED and a users browser (where the UI lives). If you can keep that straight, it will really help you as you progress.

So lets break this down. There are three things you are trying to achieve.

  1. Get some data
  2. Show that data in a chart.
  3. Save that data to a DB for later use every 5 minutes.

Actually, only step 2 might use uibuilder :slight_smile:

There isn't any point in trying to save the data "from the chart". Because Node-RED can already help you with that and it already has the data. The only reason to get uibuilder involved with step 3 would be if you wanted the USER of the chart to select what data to save. If you just want it saving every 5 minutes, get Node-RED to do that, it is what it is good at and will be a lot simpler than trying to send it to the browser and then send it back (which is where uibuilder is really doing the work).

Now, of course, step 2 is a little more complex than you initially state because actually you want the chart to update whenever new data comes along. But the Vega library may be able to do this without VueJS (we'll come back to VueJS in a moment, bear with me). This example shows you a simple web page that updates a chart from data sent over a websocket connection. Vega-Lite with Websockets - bl.ocks.org
If you look at the script embedded in the html file, you can see where it creates a websocket and listens for data over it. This is what uibuilder sets up for you. Instead of conn.onmessage = function(event) {, you would have uibuilder.onChange('msg', function(msg){ and instead of event.data, you would simply use msg. The part about cennting to the echo server and the conn.onopen isn't needed at all since uibuilder takes care of all the details for you.

I use that as an example that I hope shows that VueJS is not really needed for simple things. However, it becomes really helpful as the complexity of your web app grows.

First thing to check is that you understand there are differences between Vue v2 and v3? Stick with v2 for now as not everything is yet compatible with v3. If you are following a tutorial, it should tell you which version it is targetting.

Next, here is a QA about this topic: vue.js - Difference between .$mount() and el [Vue JS] - Stack Overflow

The answer to your question is: not a lot! All it means is that you get to choose when you create the Vue app. In by far the majority of cases, you want the app created as early as possible and so the const app = new Vue({...}) version is going to be the simplest anyway.

OMG!!! I've just managed to find some time to try and use Vega for the first time - it is HORRIBLE!!

Just a quick check ApexChart is obviously not the same as Vega - so your examples don't quite align. ApexChart is much easier to use but probably not as powerful.

The component is likely to be better for you if you are going to be creating something more complex that will benefit from a build step (using webpack, parcel or similar). Annoyingly, all the examples for vue-vega assume that you will be using a build step to "compile" the code. Example: Vue - CodeSandbox I've not managed to find any that let you load things directly.

As mentioned, apexchart isn't the same as Vega.

All that example is doing is pushing new data onto the end of the series that apexchart is showing. But, at the same time, it is dropping off the first element of the array after the new element is added so that you don't end up with an infinite number of elements in the array which would eventually crash the browser tab. push and shift are JavaScript array functions.


Right, so a quick and nasty Vega example - without VueJS for now:

image

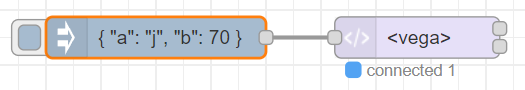
[{"id":"06557b5a92be6c25","type":"inject","z":"b533fe741719fa7a","name":"","props":[{"p":"payload"}],"repeat":"","crontab":"","once":false,"onceDelay":0.1,"topic":"","payload":"{ \"a\": \"j\", \"b\": 70 }","payloadType":"json","x":240,"y":220,"wires":[["e0e67a1f4275c9a0"]]},{"id":"e0e67a1f4275c9a0","type":"uibuilder","z":"b533fe741719fa7a","name":"","topic":"","url":"vega","fwdInMessages":false,"allowScripts":false,"allowStyles":false,"copyIndex":true,"templateFolder":"blank","extTemplate":"","showfolder":false,"useSecurity":false,"allowUnauth":false,"allowAuthAnon":false,"sessionLength":432000,"tokenAutoExtend":false,"reload":true,"sourceFolder":"src","deployedVersion":"5.0.0-dev","x":430,"y":220,"wires":[[],[]]}]

index.html

<!doctype html>
<html lang="en"><head>

    <meta charset="utf-8">
    <meta http-equiv="X-UA-Compatible" content="IE=edge">
    <meta name="viewport" content="width=device-width, initial-scale=1">

    <title>Node-RED UI Builder - Blank template</title>
    <meta name="description" content="Node-RED UI Builder - Blank template">
    <link rel="icon" href="./images/node-blue.ico">

    <link type="text/css" rel="stylesheet" href="./index.css" media="all">

</head><body>
    
    <h1>uibuilder Vega Simple Example</h1>
    <div id="view"></div>
    <pre id="msg" class="syntax-highlight">Waiting for a message from Node-RED</pre>

    <script src="../uibuilder/vendor/socket.io/socket.io.js"></script>
    <script src="https://cdn.jsdelivr.net/npm/vega@5"></script>
    <script src="https://cdn.jsdelivr.net/npm/vega-lite@5"></script>
    <script src="https://cdn.jsdelivr.net/npm/vega-embed@6"></script>
    <script src="./uibuilderfe.min.js"></script>
    <script src="./index.js"></script>

</body></html>

index.js

/* eslint-disable strict */
/* jshint browser: true, esversion: 6, asi: true */
/* globals uibuilder */
// @ts-nocheck

/** Minimalist code for uibuilder and Node-RED */
'use strict'

// return formatted HTML version of JSON object
window.syntaxHighlight = function (json) {
    json = JSON.stringify(json, undefined, 4)
    json = json.replace(/&/g, '&amp;').replace(/</g, '&lt;').replace(/>/g, '&gt;')
    json = json.replace(/("(\\u[a-zA-Z0-9]{4}|\\[^u]|[^\\"])*"(\s*:)?|\b(true|false|null)\b|-?\d+(?:\.\d*)?(?:[eE][+\-]?\d+)?)/g, function (match) {
        var cls = 'number'
        if (/^"/.test(match)) {
            if (/:$/.test(match)) {
                cls = 'key'
            } else {
                cls = 'string'
            }
        } else if (/true|false/.test(match)) {
            cls = 'boolean'
        } else if (/null/.test(match)) {
            cls = 'null'
        }
        return '<span class="' + cls + '">' + match + '</span>'
    })
    return json
} // --- End of syntaxHighlight --- //

// run this function when the document is loaded
window.onload = function() {
    // Start up uibuilder - see the docs for the optional parameters
    uibuilder.start()

    const origData = [
        { "a": "A", "b": 28 }, { "a": "B", "b": 55 }, { "a": "C", "b": 43 },
        { "a": "D", "b": 91 }, { "a": "E", "b": 81 }, { "a": "F", "b": 53 },
        { "a": "G", "b": 19 }, { "a": "H", "b": 87 }, { "a": "I", "b": 52 }
    ]
    const vlJson = {
        "$schema": "https://vega.github.io/schema/vega-lite/v5.json",
        "description": "A simple bar chart with embedded data.",
        "data": {
            //"values": origData
            "name": 'myData'
        },
        "mark": "bar",
        "encoding": {
            "x": { "field": "a", "type": "nominal", "axis": { "labelAngle": 0 } },
            "y": { "field": "b", "type": "quantitative" }
        }
    }

    // Embed visualization and save view as window.view:
    vegaEmbed('#view', vlJson).then( res => {
        res.view
            .insert('myData', origData)
            .run()

        // Save the view to window.view for later use
        window.view = res.view
    })
    //console.log(vega.changeset())

    // Listen for incoming messages from Node-RED
    uibuilder.onChange('msg', function(msg){
        console.info('[indexjs:uibuilder.onChange] msg received from Node-RED server:', msg)

        // dump the msg as text to the "msg" html element
        const eMsg = document.getElementById('msg')
        eMsg.innerHTML = window.syntaxHighlight(msg)

        var changeSet = vega
            .changeset()
            .insert(msg.payload)
            // .remove(function (t) {
            //     return t.x < minimumX
            // })
        window.view.change('myData', changeSet).run().resize()

        // Changeset needs to remove everything first, then insert new data
        // let changeset = vega.changeset().remove(() => true).insert(data);
        // For some reason source_0 is the default dataset name
        // view.change('source_0', changeset).run()
    })
}

This is based on the Blank template. It loads a simple bar chart with data defined in the js file and then allows you to load more data from the flow. I've only added a single new data item j, you'll need to amend somewhat if you want to keep adding things, at the moment, if you keep inserting the data, column j just keeps growing.

It is clear from this example that using the vue-vega component will be benefitial. It takes care of all of the c**p for you.

1 Like

Hi,

Happy New Year to all :sparkles::tada::+1:

Julian, thank you very much for putting the effort into this. As usual, now I have even more questions, but I'll get to that later. Didn't have much time to code, but I did try creating a HTML button which would run JSONata code for random number insert, however I haven't succeded creating a working JS function for it (error was myScript is not defined at HTMLButtonElement.onclick - maybe only because I'm a noob in JS or uibuilder)

Now to more important issue:
I've beed trying to create a chart using my own spec with 3 datasets, but i noticed I got the same error as you: Uncaught (in promise) SyntaxError: Unexpected token m in JSON at position 0, so thats why you commented the "values" parameter?

This is my data object:

        "data": [
            {
                "name": "length",
                "values": 'myData1',
                "transform": [
                    {
                        "type": "extent",
                        "field": "time",
                        "signal": "date"
                    }
                ]
            },
            {
                "name": "counter",
                "values": 'myData2'
            },
            {
                "name": "interrupts",
                "values": 'myData3'
            }
        ]

If I comment the values parameters then the chart don't work because I use the names afterwords in the spec..
I haven't find any solution on google, do you have some ideas?
This is the code I'm using to insert these default data arrays:

    vegaEmbed('#view', vlJson).then( res => {
        res.view
            .insert('myData1', origData1)
            .insert('myData2', origData2)
            .insert('myData3', origData3)
            .run()

        // Save the view to window.view for later use
        window.view = res.view
    })

Sorry but I've never used Vega. I simply grabbed an example from their website.

Can you provide a link please? I can't find it...

I have managed to recreate this simple example in Vue.
At the same time I'm trying to get everything working before I try to move to using Vega Vue component (using build step).
Here are my questions (if anyone have time to respond):


1. When using 2 or more VegaEmbed functions everything loads OK - the static datasets anyway. However when try to load data dynamicaly I get this error:
vega.js:123 Uncaught Error: Unrecognized data set: table

Here is only this piece of the JS code
        const origData = [
            {"x": 0, "y": 0, "c": 0}, {"x": 0, "y": 0, "c": 1},
            {"x": 1, "y": 0, "c": 0}, {"x": 1, "y": 0, "c": 1},
            {"x": 2, "y": 0, "c": 0}, {"x": 2, "y": 0, "c": 1},
            {"x": 3, "y": 0, "c": 0}, {"x": 3, "y": 0, "c": 1},
            {"x": 4, "y": 0, "c": 0}, {"x": 4, "y": 0, "c": 1},
            {"x": 5, "y": 0, "c": 0}, {"x": 5, "y": 0, "c": 1},
            {"x": 6, "y": 0, "c": 0}, {"x": 6, "y": 0, "c": 1},
            {"x": 7, "y": 0, "c": 0}, {"x": 7, "y": 0, "c": 1},
            {"x": 8, "y": 0, "c": 0}, {"x": 8, "y": 0, "c": 1},
            {"x": 9, "y": 0, "c": 0}, {"x": 9, "y": 0, "c": 1}
        ]

        var origData2 = [
            {"x": 0, "y": 58, "c": 0}, {"x": 0, "y": 55, "c": 1},
            {"x": 1, "y": 43, "c": 0}, {"x": 1, "y": 91, "c": 1},
            {"x": 2, "y": 81, "c": 0}, {"x": 2, "y": 53, "c": 1},
            {"x": 3, "y": 19, "c": 0}, {"x": 3, "y": 87, "c": 1},
            {"x": 4, "y": 52, "c": 0}, {"x": 4, "y": 48, "c": 1},
            {"x": 5, "y": 24, "c": 0}, {"x": 5, "y": 49, "c": 1},
            {"x": 6, "y": 87, "c": 0}, {"x": 6, "y": 66, "c": 1},
            {"x": 7, "y": 17, "c": 0}, {"x": 7, "y": 87, "c": 1},
            {"x": 8, "y": 18, "c": 0}, {"x": 8, "y": 16, "c": 1},
            {"x": 9, "y": 49, "c": 0}, {"x": 9, "y": 15, "c": 1}
        ]

        const vlJson = "bar.json"
        // Embed visualization and save view as window.view:
        vegaEmbed('#view', vlJson).then( res => {
            res.view
                .insert('table', origData)
                .run()
            // Save the view to window.view for later use
            window.view = res.view
        })

        const vlJson2 = "bar2.json"       
        vegaEmbed('#view2', vlJson2).then( res => {
          res.view
              .insert('table2', origData2)
              .run()
          // Save the view to window.view for later use
          window.view = res.view
      })
        //console.log(vega.changeset())


        uibuilder.onChange('msg', function(msg){
            console.info('[indexjs:uibuilder.onChange] msg received from Node-RED server:', msg)
            app.msgRecvd = msg
            app.msgsReceived = uibuilder.get('msgsReceived')
            app.lastMsg = msg

            var changeSet = vega
            .changeset()
            .insert(msg.payload)
            // .remove(function (t) {
            //     return t.x < minimumX
            // })
        window.view.change('table', changeSet).run().resize()

                // Changeset needs to remove everything first, then insert new data
                // let changeset = vega.changeset().remove(() => true).insert(data);
                // For some reason source_0 is the default dataset name
                // view.change('source_0', changeset).run()
        })

I cant find the link on the web and I have no Idea whats wrong and how to solve this..


2. I tried load the JSON using fetch like @UnborN suggested but I don't know JS good and I can't seem to find the solution on the web.

I've tried this:

        var vlJson2;
        fetch("bar.json")
        .then((response) => {
          return response.json();
        })
        .then(data => console.log(data))
        .then((data) => {
            var vlJson2 = data;
        })

but vlJson2 isn't usable outside the callback.

I've also tried this:

//var vlJson2;
fetch("bar.json")
.then((response) => {
  return response.json();
})
.then(data => console.log(data))
.then((data) => {
    //var vlJson2 = data;
    vegaEmbed('#view2', data).then( res => {
        res.view
            .insert('table2', origData2)
            .run()
        // Save the view to window.view for later use
        window.view = res.view
    })
})

But it gave me error:
Uncaught (in promise) TypeError: Cannot read properties at chart load.


3. This part I still dont understand. Is it only me or does anyone else have this kind of problems?

So, ATM I just copy-pasted the JS vega files to the static folder and I'm loading them from there.
You're saying its better to install them using NPM? like npm i vega-embed and then load to them to the uibuilder? How? I have all the uibuilder examples installed but I've only found this:

    <!-- Loading from CDN, use uibuilder to install packages and change to vendor links -->
    <script src="https://cdn.jsdelivr.net/npm/apexcharts"></script>
    <script src="https://cdn.jsdelivr.net/npm/vue-apexcharts"></script>

Simple Bar Chart | Vega-Lite

The problem is, how does your browser know the full URL of that file? It needs to be served by something. And whatever is serving it will define the URL you need to use. You can serve static files from uibuilder of course. The simple way being to put the file into the same folder as your index. files. Then the URL will be ./bar.json - note the leading ./, your browser will translate that to http://yournoderedserverip:1880/your-uib-url/bar.json or something similar. using that relative format means that if you need to move your code to a different server or turn on https or change the node-red port to something different, you don't have to edit your code, it will still work.

I'm sorry, but I wasn't asking that.

The link you provided does not contain this code:

        var changeSet = vega
            .changeset()
            .insert(msg.payload)
            // .remove(function (t) {
            //     return t.x < minimumX
            // })
        window.view.change('myData', changeSet).run().resize()

But basic chart parameters. I've been working with parameters for a month total, so I happen to know them really well...

The other answer also does not explain how do you "install and use the library using uibuilder"....

I know you're busy - I'll try to look for the answers myself.

Ah OK, maybe I came up with some of that myself. .insert(msg.payload) is the uibuilder bit of course and is hopefully pretty self-evident?

Installation of libraries to use in your front-end code is done in uibuilder via the package/library manager. It uses npm behind the scenes to install the packages in the same way as you would do things manually. But it then goes on to add the relavent folders to the ExpressJS web server on the ../uibuilder/vendor/<pkgname>/ url path. That way you can include them as link or script url's in your index.html file in the same way that the socket.io library is loaded.

OK I've managed to get everyting working properly using vue.
I wasn't using fetch because this JSON file is the chart spec not data, so it only needs to load once on startup.
Also, a multiple charts can be made with only 1 spec - res.view needs to be saved at different window var (e.g. window.view2 = res.view)

js

methods:

    methods: {

        dataLoad: function() {
            console.log('Button Pressed.')
            uibuilder.send( {
                topic: 'load'
            })
        },
        dataLoad2: function() {
            console.log('Button Pressed.')
            uibuilder.send( {
                topic: 'load2'
            })
        },
        dataReset: function() {
            console.log('Reset.')
            uibuilder.send( {
                topic: 'reset'
            })
        },

mounted:

        function startup() {
                //console.log(origData2)            
                const vlJson = "bar.json"
                // Embed visualization and save view as window.view:
                vegaEmbed('#view', vlJson).then( res => {
                    res.view
                        .insert('table', origData)
                        .run()
                    // Save the view to window.view for later use
                    window.view = res.view
                })
                vegaEmbed('#view2', vlJson).then( res => {
                    res.view
                        .insert('table', origData2)
                        .run()
                    window.view2 = res.view
                })
        }
        startup();


        uibuilder.onChange('msg', function(msg){
            console.info('[indexjs:uibuilder.onChange] msg received from Node-RED server:', msg)
            app.msgRecvd = msg
            app.msgsReceived = uibuilder.get('msgsReceived')
            app.lastMsg = msg

            if (msg.topic === 'chart_data') {
                let changeSet = vega
                    .changeset()
                    .insert(msg.payload)
                window.view.change('table', vega.changeset().insert(msg.payload).remove(view.data('table').slice(0,2))).run()//.resize()
                //remove(function (t) { return t.y1 < 2; })
                //view.remove('table', d => d.count < 5).run();
            }
            else if (msg.topic === 'chart_data2') {
                let changeset = vega
                    .changeset()
                    .remove(() => true)
                    .insert(msg.payload)
                view2.change('table', changeset).run()
            }
            else if (msg.topic === 'reset') startup()
        })

One more question. How to send message to itself - using methods.
So I have buttons on my html and I want to make a method to send a message to a mounted function uibuilder.onChange without having to send it out to the node-red. (for testing purposes)

I've tried setting this to to mounted:

        dataLoad3: function() {
            console.log('Button Pressed.')
            uibuilder.set( {
                payload: { "x": 0, "y": 20, "c":0 },
                topic: 'chart_data3'
            })
        },

but then I dont know to how to pickup the change:

        uibuilder.onChange(get, function(msg){
            console.info('[indexjs:uibuilder.onChange] msg received from Node-RED server:', msg)
            app.msgRecvd = msg
            app.msgsReceived = uibuilder.get('msgsReceived')
            app.lastMsg = msg

        if (msg.topic === 'chart_data3') {
                let changeset = vega
                    .changeset()
                    .remove(() => true)
                    .insert(msg.payload)
                view3.change('table', changeset).run()
            }
        })

You could always use the connect control msg that comes out of uibuilder's port 2 when a client connects - to send that data using a msg.

You could probably collapse those 3 down to a single method with a parameter.

You can, and probably should, use a method attached to the onClick event of the button. There is an example in one of the Vue templates in uibuilder.

In the method, you could have a switch variable that lets you dump to console instead of actually sending.

It is also possible to "send" a msg that appears to uibuilder as though it has come from Node-RED if that is what you want. uibuilder.set('msg',{payload:'hello'})

Close, but you didn't tell set what variable to change.

You don't need to do anything special if you set the msg variable, that triggers any event listeners in the same way that a message from Node-RED would.

In fact, you can register a listener on ANY uibuilder variable that is a managed one. Just by using uibuilder.onChange('varname', function(newVal) { ... }). Using set ensures that the variable is managed so you can create new variables as well as long as you avoid the reserved names. However, you don't really need to do that if you are using Vue, better to use Vue's managed data variables.

1 Like

This topic was automatically closed 14 days after the last reply. New replies are no longer allowed.