[ANNOUNCE] node-red-node-ui-vega

Hi,

I have released new Node-RED Dashboard widget node for declarative data visualization using Vega visualization grammar.
(thank you Dave for support!)

Vega is a visualization grammar and framework for visualizing data developed by University of Washington Interactive Data Lab. New ui_vega node accepts Vega and Vega-Lite data visualization specification in JSON format.

Have fun!

13 Likes

I have been waiting for this kind of visualization for so long, Thx.
Is there any example of feeding SQL data to a line chart for example?

Hi. Thank you for your interest in Vega node.
Following is a modified version of line chart example.
This flow uses node-red-node-sqlite as in-memory SQL DB.

[{"id":"4a3ebea5.226f8","type":"tab","label":"[Vega-Lite] Line & Bar Chart","disabled":false,"info":"# Line & Bar Chart Example\n\nShows overlapped line chart and bar chart.\nUses sequence of template nodes to create vega specification by merging template and data."},{"id":"678cb480.f906bc","type":"sqlitedb","z":"","db":":memory:","mode":"RWC"},{"id":"52a8715c.1cfe4","type":"ui_group","z":"","name":"Group 1","tab":"fb9c21c6.1a28a","order":1,"disp":false,"width":"10","collapse":false},{"id":"fb9c21c6.1a28a","type":"ui_tab","z":"","name":"[Vega-Lite] Line & Bar Chart","icon":"dashboard","order":6,"disabled":false,"hidden":false},{"id":"73d3f5d.0b3980c","type":"ui_vega","z":"4a3ebea5.226f8","group":"52a8715c.1cfe4","name":"Line & Bar Chart","order":5,"width":"10","height":"6","vega":"","x":880,"y":240,"wires":[]},{"id":"f0df88eb.1ad3f8","type":"template","z":"4a3ebea5.226f8","name":"Vega-Lite Spec","field":"vega","fieldType":"msg","format":"json","syntax":"plain","template":"{\n    \"width\": \"360\",\n    \"height\": \"250\",\n    \"data\": {\n        \"values\": []\n    },\n    \"layer\": [\n        {\n            \"mark\": \"line\",\n            \"encoding\": {\n                \"x\": {\n                    \"field\": \"year\",\n                    \"type\": \"temporal\"\n                },\n                \"y\": {\n                    \"field\": \"population\",\n                    \"type\": \"quantitative\",\n                    \"scale\": {\n                        \"zero\": false\n                    }\n                }\n            }\n        },\n        {\n            \"mark\": \"bar\",\n            \"encoding\": {\n                \"x\": {\n                    \"field\": \"year\",\n                    \"type\": \"temporal\"\n                },\n                \"y\": {\n                    \"field\": \"GDP\",\n                    \"type\": \"quantitative\"\n                },\n                \"color\": {\n                    \"value\": \"#080\"\n                },\n                \"fillOpacity\": {\n                    \"value\": 0.5\n                }\n            }\n        }\n    ],\n    \"resolve\": {\n        \"scale\": {\n            \"y\": \"independent\"\n        }\n    }\n}","output":"json","x":480,"y":240,"wires":[["182b6633.fcc02a"]]},{"id":"e3d24ce6.d5fe9","type":"comment","z":"4a3ebea5.226f8","name":"↓ Display on Dashboard","info":"","x":900,"y":200,"wires":[]},{"id":"7bd7f09.746ee1","type":"comment","z":"4a3ebea5.226f8","name":"↑ Add Data to Spec.","info":"","x":690,"y":280,"wires":[]},{"id":"cb5ca65e.9c7258","type":"comment","z":"4a3ebea5.226f8","name":"↓ Visualization Spec.","info":"","x":490,"y":200,"wires":[]},{"id":"a3d35227.c4932","type":"sqlite","z":"4a3ebea5.226f8","mydb":"678cb480.f906bc","sqlquery":"fixed","sql":"create table jpstat(year, population, GDP);\n","name":"Create","x":290,"y":120,"wires":[["72a612be.7fb6bc"]]},{"id":"4b1ff6d8.973648","type":"inject","z":"4a3ebea5.226f8","name":"Initialize","topic":"","payload":"","payloadType":"date","repeat":"","crontab":"","once":false,"onceDelay":0.1,"x":130,"y":120,"wires":[["a3d35227.c4932"]]},{"id":"8b29e646.1b4b18","type":"sqlite","z":"4a3ebea5.226f8","mydb":"678cb480.f906bc","sqlquery":"fixed","sql":"select year, population, gdp from jpstat;\n","name":"","x":300,"y":240,"wires":[["f0df88eb.1ad3f8"]]},{"id":"1d3a0475.d2001c","type":"inject","z":"4a3ebea5.226f8","name":"","topic":"","payload":"","payloadType":"date","repeat":"","crontab":"","once":false,"onceDelay":0.1,"x":140,"y":240,"wires":[["8b29e646.1b4b18"]]},{"id":"7f8601d3.abcbd","type":"debug","z":"4a3ebea5.226f8","name":"","active":true,"tosidebar":true,"console":false,"tostatus":false,"complete":"payload","targetType":"msg","x":870,"y":300,"wires":[]},{"id":"72a612be.7fb6bc","type":"sqlite","z":"4a3ebea5.226f8","mydb":"678cb480.f906bc","sqlquery":"fixed","sql":"insert into jpstat \nvalues \n    (1960, 92500572, 44.30734295),\n    (1961, 94943000, 53.508617739),\n    (1962, 95832000, 60.723018684),\n    (1963, 96812000, 69.498131797),\n    (1964, 97826000, 81.749006382),\n    (1965, 98883000, 90.950278258),\n    (1966, 99790000, 105.628),\n    (1967, 100725000, 123.782),\n    (1968, 101061000, 146.601),\n    (1969, 103172000, 172.204),\n    (1970, 104345000, 212.609),\n    (1971, 105697000, 240.152),\n    (1972, 107188000, 318.031),\n    (1973, 108079000, 432.083),\n    (1974, 110162000, 479.626),\n    (1975, 111940000, 521.542),\n    (1976, 112771000, 586.162),\n    (1977, 113863000, 721.412),\n    (1978, 114898000, 1013.61),\n    (1979, 115870000, 1055.01),\n    (1980, 116782000, 1105.39),\n    (1981, 117648000, 1218.99),\n    (1982, 118449000, 1134.52),\n    (1983, 119259000, 1243.32),\n    (1984, 120018000, 1318.38),\n    (1985, 120754000, 1398.89),\n    (1986, 121492000, 2078.95),\n    (1987, 122091000, 2532.81),\n    (1988, 122613000, 3071.68),\n    (1989, 123116000, 3054.91),\n    (1990, 123537000, 3132.82),\n    (1991, 123921000, 3584.42),\n    (1992, 124229000, 3908.81),\n    (1993, 124536000, 4454.14),\n    (1994, 124961000, 4907.04),\n    (1995, 125439000, 5449.12),\n    (1996, 125757000, 4833.71),\n    (1997, 126057000, 4414.73),\n    (1998, 126400000, 4032.51),\n    (1999, 126631000, 4562.08),\n    (2000, 126843000, 4887.52),\n    (2001, 127149000, 4303.54),\n    (2002, 127445000, 4115.12),\n    (2003, 127718000, 4445.66),\n    (2004, 127761000, 4815.15),\n    (2005, 127773000, 4755.41),\n    (2006, 127854000, 4530.38),\n    (2007, 128001000, 4515.26),\n    (2008, 128063000, 5037.91),\n    (2009, 128047000, 5231.38),\n    (2010, 128070000, 5700.1),\n    (2011, 127833000, 6157.46),\n    (2012, 127629000, 6203.21),\n    (2013, 127445000, 5155.72),\n    (2014, 127276000, 4850.41),\n    (2015, 127141000, 4389.48),\n    (2016, 126994511, 4926.67),\n    (2017, 126785797, 4859.95),\n    (2018, 126529100, 4970.92);\n","name":"Init","x":430,"y":120,"wires":[["679e9ed6.78c0f"]]},{"id":"679e9ed6.78c0f","type":"debug","z":"4a3ebea5.226f8","name":"","active":true,"tosidebar":true,"console":false,"tostatus":false,"complete":"false","x":590,"y":120,"wires":[]},{"id":"182b6633.fcc02a","type":"change","z":"4a3ebea5.226f8","name":"Create Spec","rules":[{"t":"set","p":"vega.data.values","pt":"msg","to":"payload","tot":"msg"},{"t":"set","p":"payload","pt":"msg","to":"vega","tot":"msg"},{"t":"delete","p":"vega","pt":"msg"}],"action":"","property":"","from":"","to":"","reg":false,"x":670,"y":240,"wires":[["7f8601d3.abcbd","73d3f5d.0b3980c"]]},{"id":"1778d9ee.5fa8c6","type":"comment","z":"4a3ebea5.226f8","name":"↓ Read DB","info":"","x":300,"y":200,"wires":[]}]

Since Vega node cannot directly access DB, DB reference results and Vega grammar are synthesized using change node.

1 Like

Thx, it is working now. I can feed mySQL data into your graph.
I just need to add multiple lines with different colors and label, how to do that? Thx

{
"width": "360",
"height": "250",
"data": {
"values":
},
"layer": [
{
"mark": "line",
"encoding": {
"x": {
"field": "RealTime",
"type": "temporal"
},
"y": {
"field": "AcY",
"type": "quantitative",
"scale": {
"zero": false
}
}
}
}
],
"resolve": {
"scale": {
"y": "independent"
}
}
}

UI

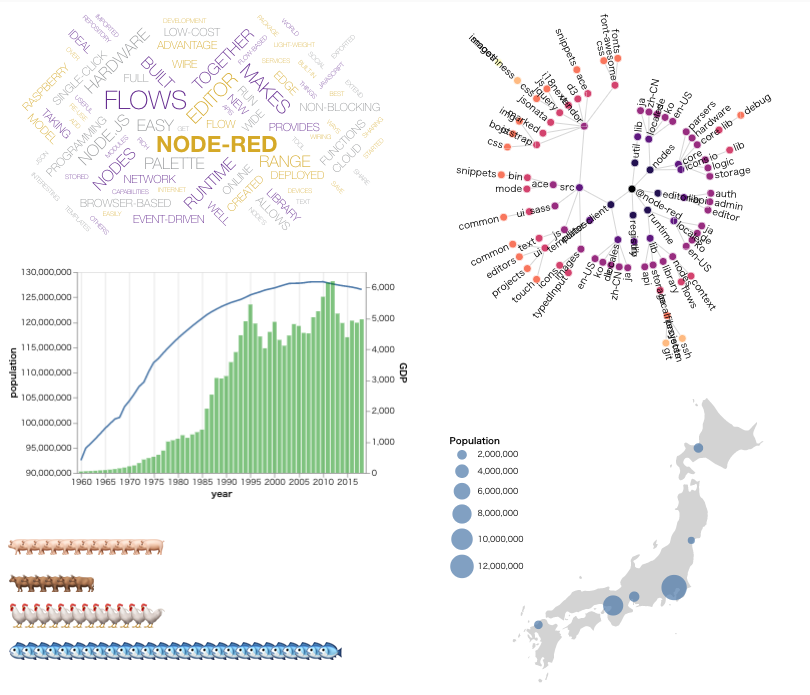
Hi. Simple solution is adding a field for distinguish lines to each data.
Vega can automatically group data and add color and show labels using specified field value.

18

[{"id":"1f906ee0.5c2161","type":"tab","label":"[Vega-Lite] Line Chart","disabled":false,"info":""},{"id":"e1975b82.6738d8","type":"ui_group","z":"","name":"Group 1","tab":"d377485b.0c8d28","order":1,"disp":false,"width":"10","collapse":false},{"id":"d377485b.0c8d28","type":"ui_tab","z":"","name":"[Vega-Lite] Line Chart","icon":"dashboard","order":6,"disabled":false,"hidden":false},{"id":"e04fbeac.c436d","type":"sqlitedb","z":"","db":"/tmp/sqlite","mode":"RWC"},{"id":"a0cc684c.322958","type":"ui_base","theme":{"name":"theme-light","lightTheme":{"default":"#0094CE","baseColor":"#0094CE","baseFont":"-apple-system,BlinkMacSystemFont,Segoe UI,Roboto,Oxygen-Sans,Ubuntu,Cantarell,Helvetica Neue,sans-serif","edited":true,"reset":false},"darkTheme":{"default":"#097479","baseColor":"#097479","baseFont":"-apple-system,BlinkMacSystemFont,Segoe UI,Roboto,Oxygen-Sans,Ubuntu,Cantarell,Helvetica Neue,sans-serif","edited":false},"customTheme":{"name":"Untitled Theme 1","default":"#4B7930","baseColor":"#4B7930","baseFont":"-apple-system,BlinkMacSystemFont,Segoe UI,Roboto,Oxygen-Sans,Ubuntu,Cantarell,Helvetica Neue,sans-serif"},"themeState":{"base-color":{"default":"#0094CE","value":"#0094CE","edited":false},"page-titlebar-backgroundColor":{"value":"#0094CE","edited":false},"page-backgroundColor":{"value":"#fafafa","edited":false},"page-sidebar-backgroundColor":{"value":"#ffffff","edited":false},"group-textColor":{"value":"#1bbfff","edited":false},"group-borderColor":{"value":"#ffffff","edited":false},"group-backgroundColor":{"value":"#ffffff","edited":false},"widget-textColor":{"value":"#111111","edited":false},"widget-backgroundColor":{"value":"#0094ce","edited":false},"widget-borderColor":{"value":"#ffffff","edited":false},"base-font":{"value":"-apple-system,BlinkMacSystemFont,Segoe UI,Roboto,Oxygen-Sans,Ubuntu,Cantarell,Helvetica Neue,sans-serif"}},"angularTheme":{"primary":"indigo","accents":"blue","warn":"red","background":"grey"}},"site":{"name":"Node-RED ダッシュボード","hideToolbar":"false","allowSwipe":"false","lockMenu":"false","allowTempTheme":"true","dateFormat":"YYYY/MM/DD","sizes":{"sx":48,"sy":48,"gx":6,"gy":6,"cx":6,"cy":6,"px":0,"py":0}}},{"id":"82a22184.c10bf","type":"ui_vega","z":"1f906ee0.5c2161","group":"e1975b82.6738d8","name":"Line Chart","order":5,"width":"10","height":"6","vega":"","x":890,"y":240,"wires":[]},{"id":"a0950706.562aa8","type":"template","z":"1f906ee0.5c2161","name":"Vega-Lite Spec","field":"vega","fieldType":"msg","format":"json","syntax":"plain","template":"{\n    \"width\": \"350\",\n    \"height\": \"230\",\n    \"data\": {\n        \"values\": []\n    },\n    \"mark\": {\n        \"type\": \"line\",\n        \"point\": false\n    },\n    \"encoding\": {\n        \"x\": {\n            \"field\": \"year\",\n            \"type\": \"ordinal\"\n        },\n        \"y\": {\n            \"field\": \"value\",\n            \"type\": \"quantitative\"\n        },\n        \"color\": {\n            \"field\": \"country\",\n            \"type\": \"nominal\"\n        }\n    }\n}","output":"json","x":500,"y":240,"wires":[["ab77d0a1.af305"]]},{"id":"a193f307.a7f57","type":"comment","z":"1f906ee0.5c2161","name":"↓ Display on Dashboard","info":"","x":920,"y":200,"wires":[]},{"id":"e5c1fbc9.a85cc8","type":"comment","z":"1f906ee0.5c2161","name":"↑ Add Data to Spec.","info":"","x":710,"y":280,"wires":[]},{"id":"a97da9da.b58858","type":"comment","z":"1f906ee0.5c2161","name":"↓ Visualization Spec.","info":"","x":510,"y":200,"wires":[]},{"id":"262294d6.179ecc","type":"inject","z":"1f906ee0.5c2161","name":"Initialize","topic":"","payload":"","payloadType":"date","repeat":"","crontab":"","once":false,"onceDelay":0.1,"x":130,"y":120,"wires":[["59c18be9.57be44"]]},{"id":"677be1d0.e1bb1","type":"inject","z":"1f906ee0.5c2161","name":"","topic":"","payload":"","payloadType":"date","repeat":"","crontab":"","once":false,"onceDelay":0.1,"x":140,"y":240,"wires":[["6b26e468.a8bdec"]]},{"id":"618cbe42.4a4b2","type":"debug","z":"1f906ee0.5c2161","name":"","active":true,"tosidebar":true,"console":false,"tostatus":false,"complete":"payload","targetType":"msg","x":890,"y":300,"wires":[]},{"id":"9a564739.a7e148","type":"debug","z":"1f906ee0.5c2161","name":"","active":true,"tosidebar":true,"console":false,"tostatus":false,"complete":"false","x":590,"y":120,"wires":[]},{"id":"ab77d0a1.af305","type":"change","z":"1f906ee0.5c2161","name":"Create Spec","rules":[{"t":"set","p":"vega.data.values","pt":"msg","to":"payload","tot":"msg"},{"t":"set","p":"payload","pt":"msg","to":"vega","tot":"msg"},{"t":"delete","p":"vega","pt":"msg"}],"action":"","property":"","from":"","to":"","reg":false,"x":690,"y":240,"wires":[["618cbe42.4a4b2","82a22184.c10bf"]]},{"id":"6eeb270.978bdd8","type":"comment","z":"1f906ee0.5c2161","name":"↓ Read DB","info":"","x":300,"y":200,"wires":[]},{"id":"59c18be9.57be44","type":"sqlite","z":"1f906ee0.5c2161","mydb":"e04fbeac.c436d","sqlquery":"fixed","sql":"create table population(country, year, value);\n","name":"Create","x":290,"y":120,"wires":[["f84d5d95.5c099"]]},{"id":"6b26e468.a8bdec","type":"sqlite","z":"1f906ee0.5c2161","mydb":"e04fbeac.c436d","sqlquery":"fixed","sql":"select year, country, value from population;\n","name":"","x":320,"y":240,"wires":[["a0950706.562aa8"]]},{"id":"f84d5d95.5c099","type":"sqlite","z":"1f906ee0.5c2161","mydb":"e04fbeac.c436d","sqlquery":"fixed","sql":"insert into population \nvalues \n    ('JP',1960,92500572),\n    ('JP',1961,94943000),\n    ('JP',1962,95832000),\n    ('JP',1963,96812000),\n    ('JP',1964,97826000),\n    ('JP',1965,98883000),\n    ('JP',1966,99790000),\n    ('JP',1967,100725000),\n    ('JP',1968,101061000),\n    ('JP',1969,103172000),\n    ('JP',1970,104345000),\n    ('JP',1971,105697000),\n    ('JP',1972,107188000),\n    ('JP',1973,108079000),\n    ('JP',1974,110162000),\n    ('JP',1975,111940000),\n    ('JP',1976,112771000),\n    ('JP',1977,113863000),\n    ('JP',1978,114898000),\n    ('JP',1979,115870000),\n    ('JP',1980,116782000),\n    ('JP',1981,117648000),\n    ('JP',1982,118449000),\n    ('JP',1983,119259000),\n    ('JP',1984,120018000),\n    ('JP',1985,120754000),\n    ('JP',1986,121492000),\n    ('JP',1987,122091000),\n    ('JP',1988,122613000),\n    ('JP',1989,123116000),\n    ('JP',1990,123537000),\n    ('JP',1991,123921000),\n    ('JP',1992,124229000),\n    ('JP',1993,124536000),\n    ('JP',1994,124961000),\n    ('JP',1995,125439000),\n    ('JP',1996,125757000),\n    ('JP',1997,126057000),\n    ('JP',1998,126400000),\n    ('JP',1999,126631000),\n    ('JP',2000,126843000),\n    ('JP',2001,127149000),\n    ('JP',2002,127445000),\n    ('JP',2003,127718000),\n    ('JP',2004,127761000),\n    ('JP',2005,127773000),\n    ('JP',2006,127854000),\n    ('JP',2007,128001000),\n    ('JP',2008,128063000),\n    ('JP',2009,128047000),\n    ('JP',2010,128070000),\n    ('JP',2011,127833000),\n    ('JP',2012,127629000),\n    ('JP',2013,127445000),\n    ('JP',2014,127276000),\n    ('JP',2015,127141000),\n    ('JP',2016,126994511),\n    ('JP',2017,126785797),\n    ('JP',2018,126529100),\n    ('US',2018,327170000),\n    ('US',2017,325150000),\n    ('US',2016,323070000),\n    ('US',2015,320740000),\n    ('US',2014,318390000),\n    ('US',2013,316060000),\n    ('US',2012,313870000),\n    ('US',2011,311580000),\n    ('US',2010,309330000),\n    ('US',2009,306770000),\n    ('US',2008,304090000),\n    ('US',2007,301230000),\n    ('US',2006,298380000),\n    ('US',2005,295520000),\n    ('US',2004,292810000),\n    ('US',2003,290110000),\n    ('US',2002,287630000),\n    ('US',2001,284970000),\n    ('US',2000,282160000),\n    ('US',1999,279040000),\n    ('US',1998,275850000),\n    ('US',1997,272650000),\n    ('US',1996,269390000),\n    ('US',1995,266279999),\n    ('US',1994,263130000),\n    ('US',1993,259920000),\n    ('US',1992,256510000),\n    ('US',1991,252980000),\n    ('US',1990,249620000),\n    ('US',1989,246820000),\n    ('US',1988,244500000),\n    ('US',1987,242290000),\n    ('US',1986,240130000),\n    ('US',1985,237920000),\n    ('US',1984,235820000),\n    ('US',1983,233790000),\n    ('US',1982,231660000),\n    ('US',1981,229470000),\n    ('US',1980,227220000),\n    ('US',1979,225060000),\n    ('US',1978,222580000),\n    ('US',1977,220240000),\n    ('US',1976,218040000),\n    ('US',1975,215970000),\n    ('US',1974,213850000),\n    ('US',1973,211910000),\n    ('US',1972,209900000),\n    ('US',1971,207660000),\n    ('US',1970,205050000),\n    ('US',1969,202680000),\n    ('US',1968,200710000),\n    ('US',1967,198710000),\n    ('US',1966,196560000),\n    ('US',1965,194300000),\n    ('US',1964,191890000),\n    ('US',1963,189240000),\n    ('US',1962,186540000),\n    ('US',1961,183690000),\n    ('US',1960,180670000),\n    ('UK',1960,52372500),\n    ('UK',1961,52807400),\n    ('UK',1962,53291800),\n    ('UK',1963,53624900),\n    ('UK',1964,53990800),\n    ('UK',1965,54349500),\n    ('UK',1966,54642700),\n    ('UK',1967,54959000),\n    ('UK',1968,55213500),\n    ('UK',1969,55460600),\n    ('UK',1970,55632200),\n    ('UK',1971,55928000),\n    ('UK',1972,56096000),\n    ('UK',1973,56223000),\n    ('UK',1974,56235000),\n    ('UK',1975,56225000),\n    ('UK',1976,56216000),\n    ('UK',1977,56189000),\n    ('UK',1978,56178000),\n    ('UK',1979,56240000),\n    ('UK',1980,56329000),\n    ('UK',1981,56357000),\n    ('UK',1982,56290000),\n    ('UK',1983,56315000),\n    ('UK',1984,56409000),\n    ('UK',1985,56554000),\n    ('UK',1986,56683000),\n    ('UK',1987,56804000),\n    ('UK',1988,56916000),\n    ('UK',1989,57076000),\n    ('UK',1990,57237000),\n    ('UK',1991,57438000),\n    ('UK',1992,57584000),\n    ('UK',1993,57713000),\n    ('UK',1994,57862000),\n    ('UK',1995,58024000),\n    ('UK',1996,58164000),\n    ('UK',1997,58314000),\n    ('UK',1998,58474000),\n    ('UK',1999,58684000),\n    ('UK',2000,58886000),\n    ('UK',2001,59113000),\n    ('UK',2002,59365000),\n    ('UK',2003,59636000),\n    ('UK',2004,59950000),\n    ('UK',2005,60413000),\n    ('UK',2006,60827000),\n    ('UK',2007,61319000),\n    ('UK',2008,61823000),\n    ('UK',2009,62260000),\n    ('UK',2010,62759000),\n    ('UK',2011,63285000),\n    ('UK',2012,63705000),\n    ('UK',2013,64105000),\n    ('UK',2014,64596000),\n    ('UK',2015,65110000),\n    ('UK',2016,65648000),\n    ('UK',2017,66040200),\n    ('UK',2018,66436000);","name":"Init","x":430,"y":120,"wires":[["9a564739.a7e148"]]}]

sorry
i use example
I don't see
i have clear screen
do it video how use

Can you see errors reported on developer JavaScript console of your browser?

Which versions of nodejs and NodeRed and node-red-Dashboard are you using ?

i have

Błąd mapy źródła: Error: request failed with status 404
URL zasobu: http://secret:1880/ui/js/app.min.js
URL mapy źródła: angular-chart.min.js.map

I use version v 1.0.3, install 2 days ago.

Which version of dashboard are you using ?

dashboard 2.19.4
raspberry pi 3 - Raspbian GNU/Linux 9 (stretch)

Are other examples such as "Line & Bar Chart" working correctly?
You may need to restart Node-RED after installing vega nodes.

i stupid
I reset computer and all ok
great job, regards

This seems extremely promising... seems you have to deal with the specification in one go though, eh? I.e., you cant setup the visualization in the node itself, and pass in the data array separately? You have to pass the entire structure at once? Or define the structure in the node, and refer to a hosted file that you write to separately for the data element?

Or use a template node to hold the structure and insert the data through that

Yeah, just trying to figure out what structure makes the most sense... I would think to get live updates, you'd HAVE to push the full object in as otherwise you're looking at a static visualization... Being able to push the data separate from schema would be nice, like msg.data for data and msg.payload for structure or something. Or maybe msg.schema to override the structure definition if you want, and msg.payload is always data.

Im just thinking it'd be cool to be able to define the vega definition in the node itself, but pass data separately without having to inject it into the data structure yourself.

Also curious, if you had something polling once a second, would it be able to keep up with a whole new chart definition every second? Is there any way to handle "stream" graphing better with vega? Completely new to it here.

So I went and looked at the API a bit... It would be neat if you could pass in something like

{
  changeSet: {
    insert: [ ... ],
    remove: function(t) { return t.timeStamp < new Date();}
  }
}

And that would automatically get passed through change API for vega... https://vega.github.io/vega-lite/tutorials/streaming.html

I know, I'm kinda saying "wouldn't it be great if you made a drop in replacement for the dashboard charting which is fairly limited" as the next logical step would be to add in an output node that gives you current data state for persistence, etc...

And I'm not even sure you can pass an anonymous function in a node-red msg...

Just thought it'd be cool.

Not really, the message has to be serialised which functions can't be I don't believe.

Having said that, I do have the capability in uibuilder to send custom JavaScript to the front-end :wink:

image

It is optional and off by default because it is a massive security hole of course! It sends as text and is then execd in the browser.

Seems like I need to create a uibuilder WIKI example for Vega Lite as I have for the other key charting tools. :grinning:

1 Like

Hello all, can node-red-node-ui-vega be created for mdashboard? If not, is there any alternative?

Vega can be used with uibuilder.