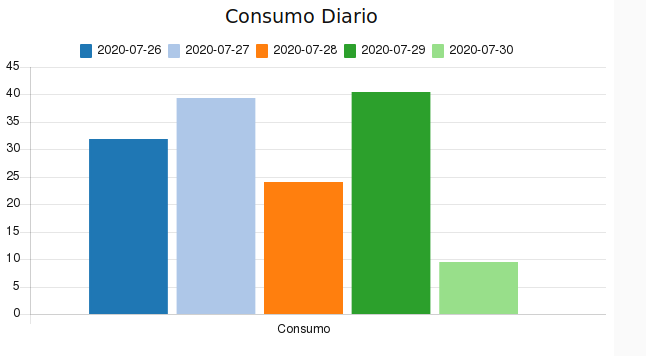
Hello! I've been struggling with this one for a while. Already read a lot of topics but I cant get why it doesn't show info in a bar graph.
[{"id":"3e0b323b.87db66","type":"inject","z":"8195f5e6.5fdde8","name":"Timestamp","props":[{"p":"payload"},{"p":"topic","vt":"str"}],"repeat":"60","crontab":"","once":false,"onceDelay":"","topic":"","payload":"","payloadType":"date","x":110,"y":620,"wires":[["e619e817.5db39"]]},{"id":"e619e817.5db39","type":"template","z":"8195f5e6.5fdde8","name":"Query Total","field":"topic","fieldType":"msg","format":"sql","syntax":"mustache","template":"SELECT DATE_FORMAT(dataLeitura,'%Y-%m-%d') dia,ifnull(round(sum(data),2),0) consumo \nFROM sensorReadings \nWHERE topic = 'casa/kwh'\nAND date(dataLeitura) >= subdate(now(),INTERVAL 5 DAY)\nGROUP BY date(dataLeitura);","output":"str","x":270,"y":620,"wires":[["b41e5140.2de518"]]},{"id":"b41e5140.2de518","type":"Stackhero-MySQL","z":"8195f5e6.5fdde8","server":"5643cdd4.526464","name":"","x":460,"y":620,"wires":[["311af654.23ae8a","a70a5c60.e1c9b8"]]},{"id":"a70a5c60.e1c9b8","type":"debug","z":"8195f5e6.5fdde8","name":"","active":true,"tosidebar":true,"console":false,"tostatus":false,"complete":"payload","targetType":"msg","statusVal":"","statusType":"auto","x":270,"y":760,"wires":[]},{"id":"311af654.23ae8a","type":"ui_chart","z":"8195f5e6.5fdde8","name":"Consumo Diário","group":"bc04c8c8.10dab","order":5,"width":0,"height":0,"label":"Consumo Diario","chartType":"bar","legend":"true","xformat":"HH:mm:ss","interpolate":"linear","nodata":"Consumo","dot":false,"ymin":"0","ymax":"","removeOlder":1,"removeOlderPoints":"","removeOlderUnit":"3600","cutout":0,"useOneColor":false,"useUTC":false,"colors":["#1f77b4","#aec7e8","#ff7f0e","#2ca02c","#98df8a","#d62728","#ff9896","#9467bd","#c5b0d5"],"useOldStyle":false,"outputs":1,"x":460,"y":680,"wires":[["a70a5c60.e1c9b8"]]},{"id":"5643cdd4.526464","type":"Stackhero-MySQL-Server","z":"","name":"sensorLog DB","host":"localhost","port":"3306","tls":false,"database":"sensorLog"},{"id":"bc04c8c8.10dab","type":"ui_group","z":"","name":"Geral","tab":"fc15d692.61a598","order":4,"disp":true,"width":"12","collapse":true},{"id":"fc15d692.61a598","type":"ui_tab","z":"","name":"Casa","icon":"fa-home","disabled":false,"hidden":false}]
I also tried with a prepare data node like this:
[{"id":"cc8c01f6.159158","type":"function","z":"8195f5e6.5fdde8","name":"Prepare Data","func":"var msg1 = {};\nlet dataH =[];\n\nfor (let X in msg.payload) \n{\n dataH.push({\"x\":msg.payload[X].dia, \"y\":msg.payload[X].consumo});\n}\nmsg1.payload = [{\"series\":[\"Consumo\"], \"data\":[dataH],\"labels\": [\"Consumo\"]}];\nreturn (msg1);\n","outputs":1,"noerr":0,"initialize":"","finalize":"","x":100,"y":660,"wires":[[]]}]
Any clues?
Thank you in advance.


