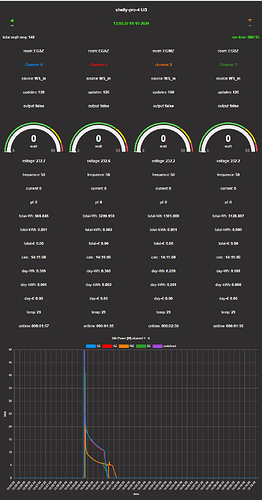
Each payload you send with a topic is taken as a series, as one payload has an undefined topic it is taken as a new series undefined.
You can reset the chart using the msg.action replace and send all the reset data in one go. You add data by sending an object with same layout as reset data. The keys for the object is set in the chart config.
here is an example
[{"id":"071abfb923a2d4c0","type":"inject","z":"d1395164b4eec73e","name":"reset data","props":[{"p":"payload"},{"p":"topic","vt":"str"}],"repeat":"","crontab":"","once":false,"onceDelay":0.1,"topic":"","payload":"","payloadType":"date","x":280,"y":7640,"wires":[["fcd2a48a9031f22f"]]},{"id":"fcd2a48a9031f22f","type":"function","z":"d1395164b4eec73e","name":"function 158","func":"msg.action = \"replace\";\nlet now = new Date().valueOf()\nmsg.payload = [\n { \n topic: \"SZ\", \n value: 0,\n time: now\n },{ \n topic: \"AZ\", \n value: 0,\n time: now \n },{ \n topic: \"WZ\", \n value: 0,\n time: now\n },{ \n topic: \"BZ\", \n value: 0,\n time: now \n }\n]\nnode.status({ text: \"chart initialisiert\" });\n\nreturn msg;","outputs":1,"timeout":0,"noerr":0,"initialize":"","finalize":"","libs":[],"x":450,"y":7640,"wires":[["5b9b55950e84d913","5583ee3f0a507d7f"]]},{"id":"5b9b55950e84d913","type":"debug","z":"d1395164b4eec73e","name":"debug 2576","active":true,"tosidebar":true,"console":false,"tostatus":false,"complete":"payload","targetType":"msg","statusVal":"","statusType":"auto","x":630,"y":7640,"wires":[]},{"id":"5583ee3f0a507d7f","type":"ui-chart","z":"d1395164b4eec73e","group":"9d83cd8b3d5ee33c","name":"","label":"chart","order":2,"chartType":"line","category":"topic","categoryType":"property","xAxisLabel":"","xAxisProperty":"time","xAxisPropertyType":"property","xAxisType":"time","xAxisFormat":"","xAxisFormatType":"auto","yAxisLabel":"","yAxisProperty":"value","ymin":"","ymax":"","action":"append","stackSeries":false,"pointShape":"circle","pointRadius":4,"showLegend":true,"removeOlder":1,"removeOlderUnit":"3600","removeOlderPoints":"","colors":["#0095ff","#ff0000","#ff7f0e","#2ca02c","#a347e1","#d62728","#ff9896","#9467bd","#c5b0d5"],"textColor":["#666666"],"textColorDefault":true,"gridColor":["#e5e5e5"],"gridColorDefault":true,"width":6,"height":8,"className":"","x":650,"y":7720,"wires":[[]]},{"id":"17909baf8ccbcf89","type":"inject","z":"d1395164b4eec73e","name":"add reading/value","props":[{"p":"payload.time","v":"","vt":"date"},{"p":"payload.value","v":"1","vt":"num"},{"p":"payload.topic","v":"SZ","vt":"str"}],"repeat":"","crontab":"","once":false,"onceDelay":0.1,"topic":"","x":310,"y":7760,"wires":[["5583ee3f0a507d7f"]]},{"id":"9d83cd8b3d5ee33c","type":"ui-group","name":"Group1","page":"c694d0ebe0d2b702","width":"6","height":"1","order":1,"showTitle":true,"className":"","visible":"true","disabled":"false"},{"id":"c694d0ebe0d2b702","type":"ui-page","name":"Page1","ui":"1805777f90e92057","path":"/page1","icon":"home","layout":"grid","theme":"a965ccfef139317a","order":2,"className":"","visible":"true","disabled":"false"},{"id":"1805777f90e92057","type":"ui-base","name":"dashboard","path":"/dashboard","includeClientData":true,"acceptsClientConfig":["ui-notification","ui-control"],"showPathInSidebar":false,"showPageTitle":true,"titleBarStyle":"default"},{"id":"a965ccfef139317a","type":"ui-theme","name":"HN Theme","colors":{"surface":"#5c5c5c","primary":"#00fdff","bgPage":"#383838","groupBg":"#4f4f4f","groupOutline":"#858585"},"sizes":{"pagePadding":"12px","groupGap":"12px","groupBorderRadius":"4px","widgetGap":"12px"}}]

