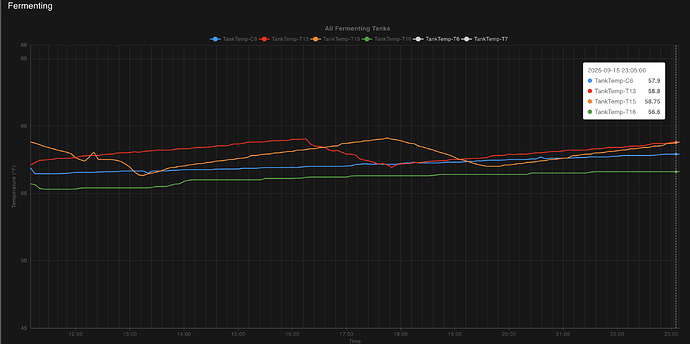
Is there a way to have the range of a chart be determined by the incoming data? Attached is a chart of temperatures of a few different tanks that are generally in the 45-65F range. If the min and max limits of the chart aren’t manually set, they automatically set from zero at the min to slighly above whatever the max incoming data is. Is there a way to have the data dynamically set that min-max? I think that was the default with Dashboard1.
[
    {
        "id": "ee8b6babee924d2c",
        "type": "ui-chart",
        "z": "11222a8aeb7f7774",
        "group": "a45d37e67f62923e",
        "name": "All Fermenting Tanks",
        "label": "All Fermenting Tanks",
        "order": 1,
        "chartType": "line",
        "category": "tank",
        "categoryType": "property",
        "xAxisLabel": "Time",
        "xAxisProperty": "time",
        "xAxisPropertyType": "property",
        "xAxisType": "time",
        "xAxisFormat": "",
        "xAxisFormatType": "auto",
        "xmin": "",
        "xmax": "",
        "yAxisLabel": "Temperature (°F)",
        "yAxisProperty": "temperature",
        "yAxisPropertyType": "property",
        "ymin": "45",
        "ymax": "66",
        "bins": 10,
        "action": "replace",
        "stackSeries": false,
        "pointShape": "circle",
        "pointRadius": "2",
        "showLegend": true,
        "removeOlder": 24,
        "removeOlderUnit": "3600",
        "removeOlderPoints": "",
        "colors": [
            "#0095ff",
            "#ff0000",
            "#ff7f0e",
            "#2ca02c",
            "#a347e1",
            "#d62728",
            "#ff9896",
            "#9467bd",
            "#c5b0d5"
        ],
        "textColor": [
            "#666666"
        ],
        "textColorDefault": true,
        "gridColor": [
            "#2b2b2b"
        ],
        "gridColorDefault": false,
        "width": "12",
        "height": "16",
        "className": "",
        "interpolation": "linear",
        "x": 780,
        "y": 1460,
        "wires": [
            []
        ]
    },
    {
        "id": "a45d37e67f62923e",
        "type": "ui-group",
        "name": "Fermenting",
        "page": "082fae9e5654c821",
        "width": "12",
        "height": "1",
        "order": 1,
        "showTitle": true,
        "className": "",
        "visible": "true",
        "disabled": "false"
    },
    {
        "id": "082fae9e5654c821",
        "type": "ui-page",
        "name": "Fermenting",
        "ui": "279a246fa8c4ae76",
        "path": "/fermenting",
        "icon": "home",
        "layout": "grid",
        "theme": "34a8f0c2a227a077",
        "order": 2,
        "className": "",
        "visible": "true",
        "disabled": "false"
    },
    {
        "id": "279a246fa8c4ae76",
        "type": "ui-base",
        "name": "My Dashboard",
        "path": "/dashboard",
        "appIcon": "",
        "includeClientData": true,
        "acceptsClientConfig": [
            "ui-notification",
            "ui-control"
        ],
        "showPathInSidebar": false,
        "headerContent": "page",
        "navigationStyle": "default",
        "titleBarStyle": "default",
        "showReconnectNotification": true,
        "notificationDisplayTime": "5",
        "showDisconnectNotification": true,
        "allowInstall": true
    },
    {
        "id": "34a8f0c2a227a077",
        "type": "ui-theme",
        "name": "Dark Theme",
        "colors": {
            "surface": "#000000",
            "primary": "#0094ce",
            "bgPage": "#303030",
            "groupBg": "#171717",
            "groupOutline": "#cccccc"
        },
        "sizes": {
            "density": "default",
            "pagePadding": "12px",
            "groupGap": "6px",
            "groupBorderRadius": "4px",
            "widgetGap": "2px"
        }
    }
]

