I have searched this but not found any helpful items.
I have a fairly extensive (large) NR program running various things for my home control. There are 18 tabs and a significant amount of JS code. The flows_xxxxxxxxxxxxx.json file is 774Kb.
When I have debug set to "all nodes" and I look at an item I cannot tell which tab that msg was generated from. Here is an example:
10/4/2023, 2:59:59 AM[node: 8b4aaae7.fc5298]'(http://192.168.xxx.xxx:1880/#)
msg.payload : Object

object
code: 0
Is there a better way to identify the tab and node that generated the message other then switching to "current flow" and jumping through them all?
Click here - it will take you to the node

Awesome.  Thank you. That works great.
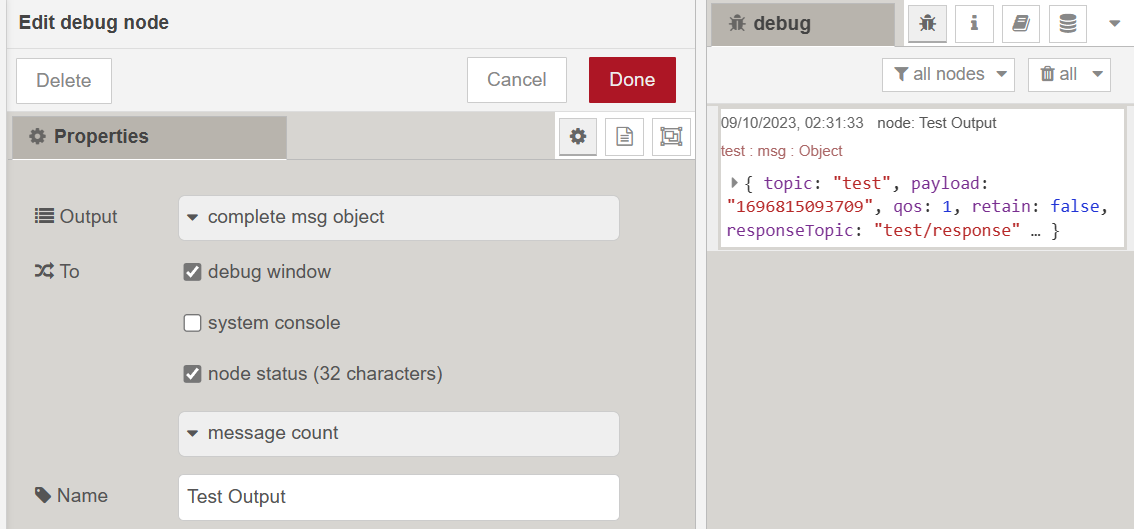
Giving your debug nodes sensible names also helps you to spot things quickly.
Not sure your meaning. All tabs and Nodes have sensible names. They just don't appear in the debug window. Only this does
node: 8b4aaae7.fc5298
Put a name into the debug node and you see that name in the debug output. Makes life a lot easier.
I don't know how to use this when the error is generated within code I'm writing.
Sorry, I think we may be talking at cross-purposes.
What I showed was the settings for a debug node in your flow. Simply edit the default "Debug xxxx" name and replace it with something more meaningful. Then, when it receives a message, the debug panel will have the name not just the reference ID. May save you having to always click the id simply to see where the debug came from.
if you are trying to debug a function node use
node.warn('db01= ' + some_variable)
For example, with this code:
let b = "i am a bug"
node.warn('db1= ' + b)
return msg;
you will get this: