hi,
I have a DHT22 sensor and I'm sampling it every 1 min.
I'm saving the data to a global variable called Chart.
I have a few days of data in the global variable and I want to see for example yesterdays samples in a chart.
I want to use a date picker Dashboard to choose the date from which the data will be shown.
How to I filter the global variable to display the right information?
thank you .

Hi.
Unfortunately, without any sample data or indication of which dashboard you are using, it is pretty much impossible to give you a solution without guessing.
All I can say is wire the date to a debug to see what it outputs. Then wire it to a function that gets your data from context and filters it to your date value, then format the data according to the charts input requirement.
this is how it looks in /home/pi/.node-red/context/global/global.json
i only want to show on the chart the values where x=1759139487 and greater
and not all the data.
"tempAndHumidChart": [
        {
            "series": [
                "Air Temp",
                "Air humid"
            ],
            "data": [
                [
                    {
                        "x": 1759216527992,
                        "y": 22.8
                    },
                    {
                        "x": 1759216587989,
                        "y": 23
                    },
                    {
                        "x": 1759216588593,
                        "y": 23
                    },
                    {
                        "x": 1759216659177,
                        "y": 23.3
                    },
                    {
                        "x": 1759216718965,
                        "y": 23.4
                    },
                    {
                        "x": 1759216719248,
                        "y": 23.4
                    },
                    {
                        "x": 1759216740697,
                        "y": 23.4
                    },
                    {
                        "x": 1759216800197,
                        "y": 23.7
                    },
                    {
                        "x": 1759216800841,
                        "y": 23.7
                    }, .......
this is from NR debug:

It's rather frustrating that you still have not said which dashboard version you have installed.
The common options are node-red-dashboard and @flowfuse/node-red-dashboard.
And you have only shared partial data. For sure we don't need all 270 data points but the way you have truncated it results in data we can't import.
Since you have not state which dashboard, I can only assist with the filtering part. You will have to determine how to integrate this.
So, you can filter the data using a function or JSONata in change node or a few other ways.
I would propose you feed the date from the date node into a function, calculate the "range" (midnight to midnight), filter and return data.
Something like:
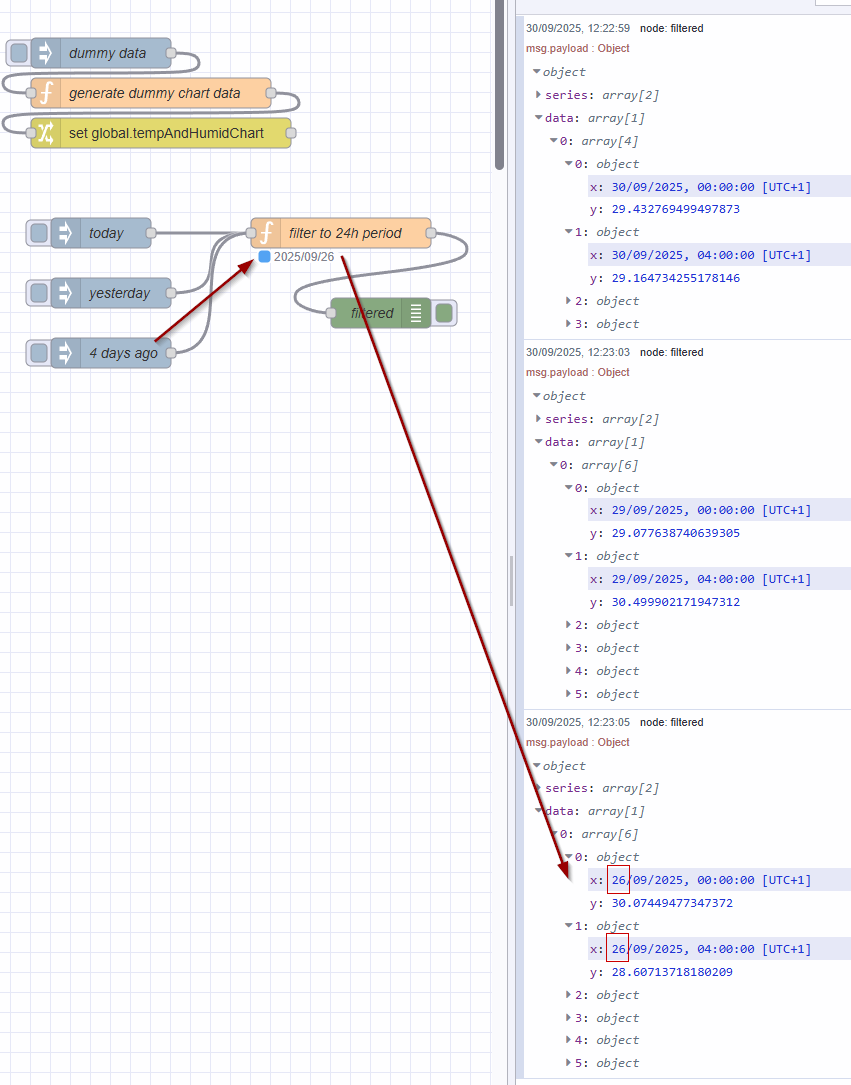
Demo flow (use CTRL+I to import)
[{"id":"776019a2eee5e322","type":"function","z":"07e9510c8d326604","name":"filter to 24h period","func":"\nconst chartData = global.get('tempAndHumidChart');\n\n// Expect target date timestamp is in msg.payload\nconst targetTimestamp = new Date(msg.payload);\n\n// get range\nconst targetDate = new Date(targetTimestamp)\nconst startOfDay = new Date(targetDate) // start of day (00:00:00.000)\nstartOfDay.setHours(0, 0, 0, 0); \nconst startMillis = startOfDay.getTime();\nconst endOfDay = new Date(startOfDay); // end of day (23:59:59.999)\nendOfDay.setDate(startOfDay.getDate() + 1); \nendOfDay.setTime(endOfDay.getTime() - 1);\nconst endMillis = endOfDay.getTime();\n\n// set status to filter date e.g. \"2025/09/30\"\nconst statusDate = `${targetDate.getFullYear()}/${(targetDate.getMonth() + 1).toString().padStart(2, '0')}/${targetDate.getDate().toString().padStart(2, '0')}`\nnode.status({fill:\"blue\",shape:\"dot\",text: statusDate})\n\nconst timeRangeFilter = (point) => {\n // 'point' is expected to be an object like { \"x\": 1759216527992, \"y\": 22.8 }\n return point.x >= startMillis && point.x <= endMillis;\n}\n\nif (chartData && Array.isArray(chartData.data)) {\n // assume the data structure is: \n //[ { \"series\": [...], \"data\": [[array], [array]] } ]\n const filtered = {\n series: [...chartData.series],\n data: []\n };\n filtered.data = chartData.data.map((subArray) => subArray.filter(timeRangeFilter))\n msg.payload = filtered;\n return msg;\n}\n\n// if we get here, data is not valid\nnode.warn(\"Chart data not found in global context or is empty.\");\n\n","outputs":1,"timeout":0,"noerr":0,"initialize":"","finalize":"","libs":[],"x":870,"y":260,"wires":[["b798184066b7f23a"]]},{"id":"6688773f7b371f19","type":"inject","z":"07e9510c8d326604","name":"dummy data","props":[{"p":"payload"},{"p":"topic","vt":"str"}],"repeat":"","crontab":"","once":false,"onceDelay":0.1,"topic":"","payload":"","payloadType":"date","x":630,"y":80,"wires":[["38fbf66935e2e96e"]]},{"id":"777a16907809b71f","type":"change","z":"07e9510c8d326604","name":"","rules":[{"t":"set","p":"tempAndHumidChart","pt":"global","to":"payload","tot":"msg"}],"action":"","property":"","from":"","to":"","reg":false,"x":690,"y":160,"wires":[[]]},{"id":"38fbf66935e2e96e","type":"function","z":"07e9510c8d326604","name":"generate dummy chart data","func":"const startTime = new Date()\nstartTime.setDate(startTime.getDate() - 5)\nstartTime.setMinutes(0, 0, 0)\n\nconst endTime = new Date()\nendTime.setMinutes(0, 0, 0)\n\nconst data = []\n\n// generate samples 4h apart (to keep this small)\nfor (let time = startTime; time <= endTime; time.setHours(time.getHours() + 4)) {\n const x = time.getTime()\n const y = Math.random() * (31.0 - 28.5) + 28.5\n data.push({ x, y })\n}\n\nmsg.payload = {\n \"series\": [\n \"Air Temp\",\n \"Air humid\"\n ],\n \"data\": [data]\n}\n\nreturn msg","outputs":1,"timeout":0,"noerr":0,"initialize":"","finalize":"","libs":[],"x":680,"y":120,"wires":[["777a16907809b71f"]]},{"id":"3c7165e2d21ce4f7","type":"inject","z":"07e9510c8d326604","name":"today","props":[{"p":"payload"},{"p":"topic","vt":"str"}],"repeat":"","crontab":"","once":false,"onceDelay":0.1,"topic":"","payload":"$moment()","payloadType":"jsonata","x":630,"y":260,"wires":[["776019a2eee5e322"]]},{"id":"92bd8bcac398d353","type":"inject","z":"07e9510c8d326604","name":"yesterday","props":[{"p":"payload"},{"p":"topic","vt":"str"}],"repeat":"","crontab":"","once":false,"onceDelay":0.1,"topic":"","payload":"$moment().add('days', -1)","payloadType":"jsonata","x":640,"y":320,"wires":[["776019a2eee5e322"]]},{"id":"b798184066b7f23a","type":"debug","z":"07e9510c8d326604","name":"filtered","active":true,"tosidebar":true,"console":false,"tostatus":false,"complete":"payload","targetType":"msg","statusVal":"","statusType":"auto","x":910,"y":340,"wires":[]},{"id":"58cc6bd76e6cca13","type":"inject","z":"07e9510c8d326604","name":"4 days ago","props":[{"p":"payload"},{"p":"topic","vt":"str"}],"repeat":"","crontab":"","once":false,"onceDelay":0.1,"topic":"","payload":"$moment().add('days', -4)","payloadType":"jsonata","x":640,"y":380,"wires":[["776019a2eee5e322"]]}]
Dear
Steve,
I’m sorry it toke me so long to reply.
Thank you for your script.
It works perfectly with your dummy data,
But it does not work with any of my global variable.
I’ve noticed that there are another lines in my global variable:
“0:object”
"labels:"
I will appreciate if you can modify your script work with this configuration:

this is from the dummy file:

.
Kind regards.