Hi Forum,
I'm new to this forum and I want ask a first question.
I try to get data from Netatmo Weather Station using Node-Red.
Before Netatmo changed from "user/password" authentication to "oauth2" everything went well for a long time. After changing RasPi Hardware I changed the Node-Red flow using the "NetAtmo Dashboard" node.
Authentication with client ID, client secret and refresh token seams to work in the flow - no error appears.
But the flow shows no data - the debug shows errors for example:
msg.payload.temperature : undefined
I read somewhere that the payload syntax is changed.
How is the right format to visualise the gathered data?
Thanks for support,
Juergen
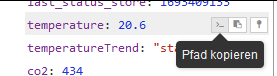
Just put a debug node behind the NetAtmo Dashboard node and you will get something like:
And if you click on the leftmost icon next to the desired data you can just copy the path to your clipboard:
Hi Stefan,
thx. for answering! I'm not experienced in developing flows - so can you please give a bit more advice how to implement what you suggest?
Thx 
Put these 3 nodes together: (it doesn't have to be debug 40 in your case!!)
Then click on the debug panel:

And press inject. Then you will see the date like mine above.
Hi Stefan, it works and I see data - I try next steps and come back if I have additional questions.
What do you mean with
"And if you click on the leftmost icon next to the desired data you can just copy the path to your clipboard:" ?
Just look at the screenshot above at "Pfad kopieren".
Next to temperature (and all other data) you see these 3 icons if your cursor is on this line.
Du solltest evtl. mal hier einige Zeit verbringen:  Documentation : Node-RED
Das mache ich gerne - auf jeden Fall hast du mich schon mal aufs richtige Gleis gesetzt:
"msg1.payload = payload.compact.temperature;"
Das ist wohl der Pfad - ich versuche das nun mal einzubauen.
Bin aber ab 18h offline - eventuell schreibe ich morgen noch mal dazu - erst einmal vielen Dank
Hi Forum,
hi Stefan,
first of all - issue is fixed. Thanks to Stefan, adding a Debug Node and getting the path for the values did solve my problem. Also thx. Stefan for the PN - I'll look into that!
Now I try try to improve my current dashboard which is now back working. Maybe I'll find a way to interpret "pressure_trend" from text to graphic or arrow... let's see

