🚀 [FlexDash] alpha release - a dashboard for Node-RED

I'll look into it, thanks for reporting!

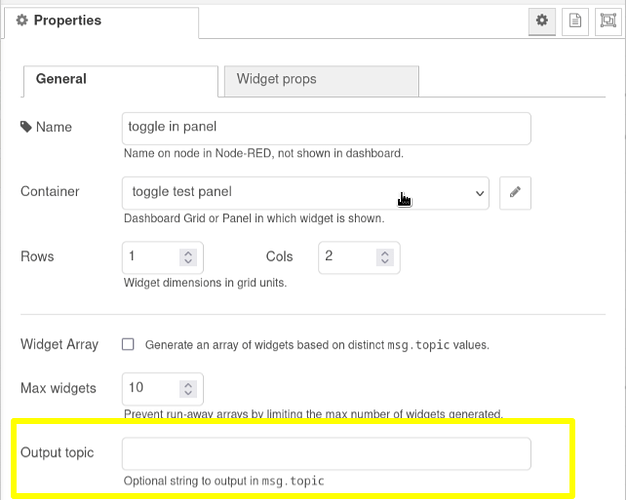
The background here is that FD is independent of Node-RED and doesn't know anything about NR. I'm using the "topic" that FD widget outputs have to route to Node-RED... But that doesn't mean that the generated node can't add a msg.topic... One issue though is that the topic is already set by array widgets so you know which of the widgets in the array produced the output. We could restrict the explicitly set topic to be a string for array widgets and prepend it... Thoughts?

Looks like I have:

  • add ripple to toggle
  • add option to do local feedback of output to input
  • troubleshoot "only every second click is sent"
  • come up with solution to add topic to output messages
2 Likes

1 down, 3 to go :stuck_out_tongue_winking_eye:

  • I added the local feedback option.
  • There is already a ripple effect, but there's some weird stuff happening in Vuetify making it inconsistent and often barely visible. Opened an issue.
  • I looked into the "only every second click" problem and it resulted in another Vuetify issue. That one now has a "bug" tag, so progress... (Vuetify 3 is still in beta...)

The help text for the toggle now reads:

  help: `Simple on/off toggle switch.
Sends a pre-determined value when toggled on or off. The current state can be set via the
value input: the toggle will be "on" IF the value is equal to the "on_value" input.

By default clicking the toggle shows a "ripple" effect and outputs a message but does not toggle
the switch. The switch is only toggled in response to an input change. If no input is received,
the toggle will "stick" to its prior state and repeated clicking will send the same output.

By setting \`loopback\` to true, the toggle will internally feed the output value to its input
causing the toggle to immediately change to the new state. Repeated clicking will then alternate
between the on & off values.
`,

  props: {
    value: { default: null, dynamic: "toggle", tip: "set toggle value" },
    enabled: { type: Boolean, default: true },
    color: { type: String, default: "primary" },
    on_value: { default: true, tip: "value sent when switched on" },
    off_value: { default: false, tip: "value sent when switched off" },
    show_value: { type: Boolean, default: true, tip: "display current value" },
    loopback: { type: Boolean, default: false, tip: "internally loop-back output to input" },
  },

Release:

22 Aug 21:45:04 - [info] Node-RED FlexDash plugin version 0.4.92                                    
22 Aug 21:45:05 - [info] Node-RED FlexDash version 0.4.92                                           
22 Aug 21:45:05 - [info] Node-RED FD Core Widgets version 0.4.40                                    
22 Aug 21:45:08 - [info] FlexDash UI version 0.4.49                                                 

Update: making progress on the output topic. The way it's shaping up is:

and if the user selects the "Widget array" feature it changes to:
image

This is something that all widgets producing output will have automatically.

3 Likes

Looks good to me.

Brilliant

I have had a stab at an initial spec for a dropdown select box, based mostly on the ui_dropdown node. Hopefully it may be some use as a starting point.

  help: `Dropdown select box.
  Allows the selection of a single or multiple options from a dropdown select box.
  Each option is defined by a value (which is the value returned when the option is selected) and optionally a label string which is the string shown in the dropdown.  If the label is not provided then the value is used as the label.
  When an option is clicked then then the configured value is returned in msg.payload, unless Allow multiple options is selected, in which case an array of values is returned when the user clicks away from the list.
  Setting msg.payload to one of the item values will preset the choice in the dropdown. If using the multi-select option then the payload should be an array of values.`,

  props: {
    enabled: { default: true },
    title: { default: 'Select' , tip: "Optional text to show in the widget header"},
    options: { ?? },  // I don't know how to specify this, it could just be an array of values and/or label value pairs, formatted as can be supplied to ui_dropdown node in msg.options, or possibly an extendable table, again as in the ui_dropdown node.
    allow_multiple_selections: { default: false },
  },
1 Like

Getting started...:
image

image

image

I'm having trouble with the looks, I'm using a Vuetify v-select and I may be better off using a v-menu 'cause the v-select is for form fields and has space for a label and validation error messages that cause issues. Plus some of that stuff is not as configurable as it should be, it seems.

Code:

<!-- DropdownSelect -- A drop-down select widget to choose one or multiple options from a list
     Copyright ©2022 Thorsten von Eicken, MIT license, see LICENSE file
-->
<template>
  <div class="ma-auto">
  <!-- looks like the v-select isn't fully baked... need to force some stuff into its descendents-->
  <v-defaults-provider :defaults="{global:{density:'compact', variant:'solo', hideDetails:true}}">
    <v-select :model-value="currentValue" v-bind="bindings" @update:modelValue="change($event)"
              class="mb-n2" />
  </v-defaults-provider>
  </div>
</template>
  
<script scoped>

export default {
  name: 'DropdownSelect',
  
  help: `Dropdown select box.
  Allows the selection of a single or multiple options from a dropdown select box.
  Each option is defined by a value (which is the value returned when the option is selected
  and optionally a label string which is the string shown in the dropdown.
  If the label is not provided then the value is used as the label.

  When an option is clicked then then the configured value is sent,
  unless \`allow_multiple\` is selected, in which case an array of values is sent when the user
  closes the drop-down list, e.g. by clicking outside of it.

  Setting value to one of the item values will preset the choice in the dropdown.
  If using the multi-select option then the value should be an array.`,

  props: {
    enabled: { default: true },
    value: { default: null, tip: "value of selection to show in the box" },
    choices: { type: Array, default: [], tip: "list of choices" },
    labels: { type: Array, default: [], tip: "list of labels for choices" },
    allow_multiple: { type: Boolean, default: false },
    color: { type: String, default: "primary" },
  },
 
  output: true,

  data() { return {
    currentValue: null,
  }},

  watch: {
    value: {
      immediate: true, // causes handler to be called when component is mounted
      handler(v) { this.currentValue = v },
    },
  },

  computed: {
    // construct the bindings passed into v-select
    bindings() {
      return {
        disabled: !this.enabled,
        multiple: !!this.allow_multiple,
        items: this.items,
        color: this.color,
      }
    },

    // produce the list of items in the form of an array of objects with title and value fields
    items() {
      if (!Array.isArray(this.choices)) return []
      const labels = Array.isArray(this.labels) ? this.labels : []
      return this.choices.map((c, ix) => {
        const label = labels[ix] || c
        return {
          title: label,
          value: c,
        }
      })
    }
  },

  methods: {
    change(ev) {
      this.currentValue = ev
      this.$emit('send', ev)
    },
  },

}
</script>

I'll need to tweak this some more...

1 Like

Just installed your latest, and using a data buffer to persist chart data between browser sessions, which although appears to work OK...

waves

[{"id":"02a8193ebdb37b8f","type":"fd-time-plot","z":"1543d308b342690a","fd_container":"28d1859702cdf729","fd_cols":"3","fd_rows":"3","fd_array":false,"fd_array_max":10,"name":"","title":"Waves","popup_info":"","data":"","labels":["sin","cos"],"colors":[],"axes":[],"widths":[],"span_gaps":[],"left_unit":"","right_unit":"","left_min":"","left_max":"","left_decimals":1,"right_min":"","right_max":"","right_decimals":1,"x":515,"y":260,"wires":[[]]},{"id":"d2a94db941e6b041","type":"inject","z":"1543d308b342690a","name":"","props":[{"p":"payload"},{"p":"topic","vt":"str"}],"repeat":"0.5","crontab":"","once":true,"onceDelay":0.1,"topic":"","payload":"","payloadType":"date","x":150,"y":260,"wires":[["124e90842dd03c49"]]},{"id":"124e90842dd03c49","type":"function","z":"1543d308b342690a","name":"Chart Persistance","func":"let data = flow.get('chartTest') || []\nlet now = msg.payload\nlet s = Math.sin(now / 10000)\nlet c = 1.2 * Math.cos(now / 13000)\ndata.push( [now / 1000, s, c] )\nwhile (data.length > 200) data.shift()\nflow.set('chartTest', data)\nmsg.payload = data\nmsg.labels = [\"sin\", \"cos\"]\nreturn msg","outputs":1,"noerr":0,"initialize":"","finalize":"","libs":[],"x":340,"y":260,"wires":[["02a8193ebdb37b8f"]]},{"id":"28d1859702cdf729","type":"flexdash container","name":"grid6","kind":"StdGrid","fd_children":",02a8193ebdb37b8f,d2dbe97c44f6fb5a","title":"","tab":"9f23b0158f8280e3","min_cols":"1","max_cols":"20","parent":"","solid":false,"cols":"1","rows":"1"},{"id":"9f23b0158f8280e3","type":"flexdash tab","name":"chart","icon":"mdi-chart-line","title":"","fd_children":",28d1859702cdf729","fd":"e8f5aea52ab49500"}]
3 Likes

Haha, good one!

Also, if I maximise the chart, the tooltips are absent, and I have a small grey (x,y) box in the middle.

waves2

Can you confirm which version of FlexDash you're running? It says in orange in the very top-right hand corner of the window, e.g. "alpha v0.4.49". The tooltip works for me when maximized and it's something I fixed recently. Of course, that doesn't mean there isn't some other issue lurking...

version alpha v0.4.49
version

I've tried clearing the browser cache (and also a incognito browser window)

1 Like

I see the same effect (missing tooltips), using @Paul-Reed's flow with chart maximised.

2 Likes

Thanks for the info, I now see it too in Vivaldi. Was using firefox and there it works great. On to debugging browser differences...

BTW, thanks for flagging all these issues, I can't find them all on my own!

1 Like

I'm using Chrome, but using Firefox I do get tooltips, but as above they appear & stay in their masses :laughing:

firefox

1 Like

Yes, but the font is completely wrong... Should be Roboto, which is a sans-serif font. Is the font for the rest of the dashboard also incorrect?

The tooltip masses congregate where there are lots of plot updates, I'm evidently not removing the tooltip before some update event. Have to dig into uPlot to see where I'm missing a callback.

1 Like

As far as I can see, no, I'm seeing Roboto elsewhere.
It's just different in the tooltips.

1 Like

I believe I fixed all the known tooltip issues. Note the "known" qualifier :stuck_out_tongue_winking_eye:
Well, actually, there's one unfixed issue for which I'm awaiting some upstream info, which is that the tooltip disappears until the cursor is moved if the options for the plot are changed. Updating just the data (as is the case in Paul's flow) is fine.
Again thanks for flagging the issues and providing a simple repro flow!

New release with fixes:

24 Aug 10:24:56 - [info] Node-RED FlexDash plugin version 0.4.93                                    
24 Aug 10:24:57 - [info] Node-RED FlexDash version 0.4.93                                           
24 Aug 10:24:57 - [info] Node-RED FD Core Widgets version 0.4.40                                    
24 Aug 10:24:59 - [info] FlexDash UI version 0.4.50                                                 

I have not been able to reproduce the font issue with the maximized widget but I suspect that my fix fixes that too. Please let me know if it doesn't.

3 Likes

Yes, that fixes both issues :+1:
Not a big problem, but I've noticed that the 'maximised' charts are displayed clearer than the default view.
In the example below, both lines are set to 1 point, and note the tooltip box size. Both are smaller & sharper in the 'maximised' view, even the background shade is lighter.
Is this just a anomaly of uPlot?

chart

1 Like

This may be due to grid scaling. See http://core2:4000/using-flexdash/grid-panel-layout/#grids
You can look to the bottom right of the grid and if it says "Grid scaling 1.2x" or so in the margin then it's scaled up to fill the width of the page (up to 1.33x).

[EDIT by Paul-Reed] The working link for the grid documentation is Grid and Panel layout - FlexDash

Edit by tve: ugh, thanks, I guess I was really distracted when I pasted that!

1 Like

Ah yes. I'm seeing that it's currently scaled 1.16x, but changing the size of the Max Columns in the Flexdash container config to 10, removes the scaling, and makes the chart much sharper & clearer.
I need to read the documentation again, to try and fully grasp the concept of grid sizing!

Really liking the chart (time plot) node, more options to use than the ui-chart node, and the resulting charts are excellent :smiley:

2 Likes

If you succeed then please spread the knowledge. :slight_smile:

1 Like