You are making nice progress.
I wanted to use uPlot for another standalone project but can not figure out how to show tooltip and color coded legend below graph at the same time as you are showing.
Can you please share code for uPlot setup?
Thanks.
You are making nice progress.
I wanted to use uPlot for another standalone project but can not figure out how to show tooltip and color coded legend below graph at the same time as you are showing.
Can you please share code for uPlot setup?
Thanks.
Code is all on github. The uPlot wrapper widget/component is flexdash/time-plot-raw.vue at main · tve/flexdash · GitHub and the JS code for the tooltip comes from flexdash/uplot-tooltip.js at main · tve/flexdash · GitHub
It's the basic tooltip example from the uplot demos plus a day of fiddling 
Very interesting project indeed!
Maybe you have it but what about security for login? How is that handled?
I also have to chime in regarding multi-user and multi-tenant use cases. Those currently missing features is one major reason why Node-RED really can't be deployed in such installations. The mentioned freeboard alternative is maybe a possible way but it would be so much better if it would be "better integrated" with Node-RED itself. It's eay to wish, I know, and I have no clue if the current Node-RED has all the necessary properties on objects to allow for multi-user and multi-tenant (multi owners)
Thanks for the encouragement!
The current security for login is nil 
It's not something I've thought much about, I need to have more things in place before it really becomes meaningful.
WRT multi-tenancy, there's nothing a dashboard can do to make Node-Red somehow multi-tenant. If you want multiple users hacking their own flows your best bet IMHO is to spin up a NR instance per user. Containers are your friend here...
What a dashboard can do is provide different types of users access to what's cooking in NR. So a primary user can hack-up awesome flows and then provide access to different portions of the data produced by these flows to different dashboard users.
@tve Thank you for the links.
Looks like I'm doing "weekly progress updates" here... 
This week I spent a lot of time on server connections:
I believe with these improvements FlexDash has reached a state where I can start to migrate from the current dashboard to FlexDash! There's still a long to-do list and I'm sure I'll hit problems instantaneously as soon as I attempt to migrate, but there's also progress 
Server connections config panel:
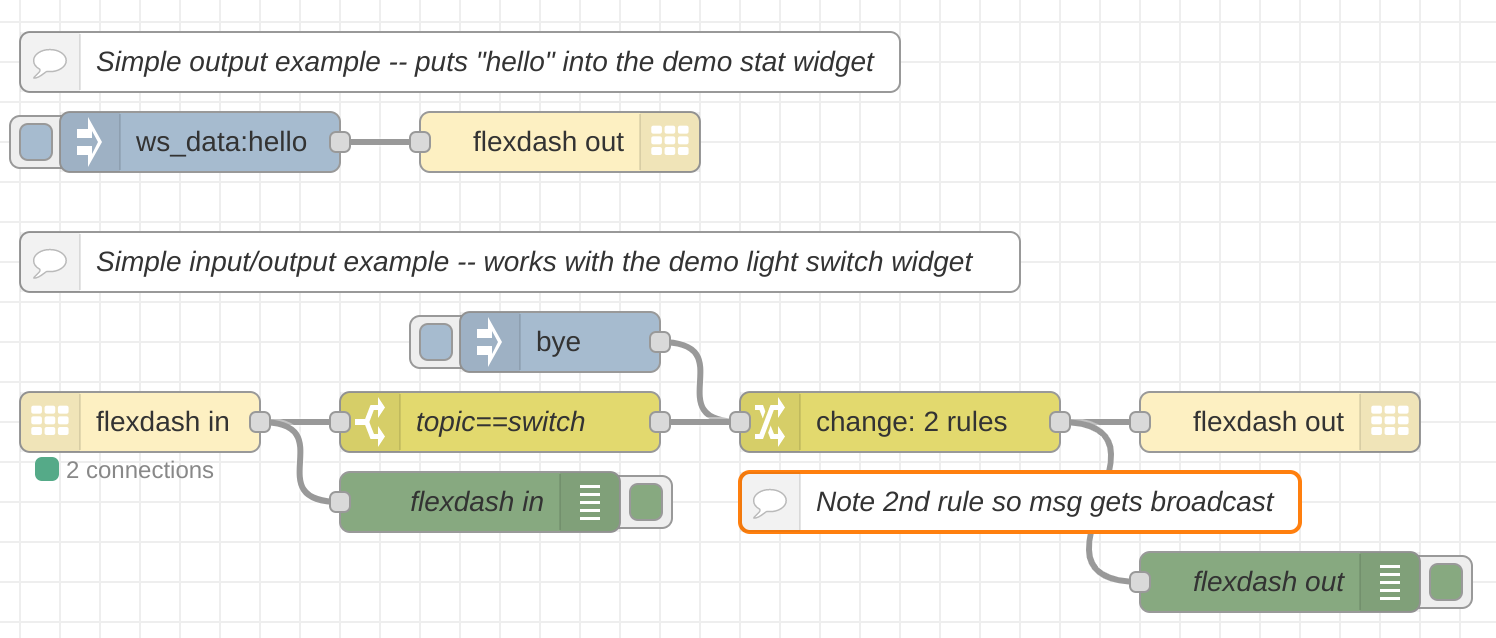
Demo flow with socket.io-based FlexDash nodes:
Ha, so far 1:1 on the score of "it just works" vs. "oops, gotta fix something"
On the positive front, I have all my sensor data loaded in the dashboard  It was already all finding its way to a database node to be persisted so all I needed to do is to fork the data stream of into a couple of nodes to massage the format and push it into FlexDash :-).
This is a fragment of my "insert into the DB" flow with a link node on the left that receives sensor data from all the other flows, so I added a link-out node to forward the data to a flexdash flow:
The flexdash flow is really quite simple with an "annotate" node that uses some context tables to convert sensor IDs to names and such. And then everything goes into the topic tree with a path like devices/kitchen/temperature for the temperature and devices/kitchen/temperature_u for the unit (C) in this case.
On the "oops" front, my production Node-RED server is still on http (not https) and that makes it impossible to load flexdash from github and connect to Node-RED due to "mixed content" restrictions. (Any attempt to access http://tve.github.io/flexdash gets auto-upgraded to https.) I solved that by pushing flexdash to S3, so this works:
http://s3.voneicken.com/flexdash/0.1.1/index.html?sio=http://core.voneicken.com:1880/io/flexdash/
Of course the better solution is to upgrade my Node-RED install to https, which will happen soon
Quick note that Paul found some bugs, which I fixed resulting in a new version on https://tve.github.io/flexdash and s3, the latter being http://s3.voneicken.com/flexdash/0.1.2/index.html
I need to improve this release engineering stuff...  what was I thinking? was I thinking?
Quick heads-up that I'm hitting more issues than I'd like (mostly having to do with the reactivity stuff) so I recommend to hold off trying FlexDash until I shake more of the issues out myself...
Nothing really in dashboard though I think Dashboard does now support middleware which could be used to help.
However, uibuilder is building out a standardised security capability that will allow for multi-user use. Some parts are already there in v3 but it certainly isn't production ready yet with more work to be done.
Node-RED itself does have multi-user capability - to a degree - and supports PassportJS. Though my personal recommendation is to do such things outside of Node-RED using a reverse proxy. Keeping your security layer separate from your development layer.
Weekly status update
This is the old dashboard front page, which is really a Grafana iframe:
I spent quite some time this week getting the uPlot stuff to work well, which meant dealing with resize events, switching between tabs, sizing the values on the axes correctly, yadda yadda.
I also switched the sparkline from the stupid vuetify thing to uPlot, added a color picker with the material design colors for the widget editing, and a tree picker to link widget inputs to a topic.
Color picker:
Topic tree picker:
There are still little issues left and right but I'm hitting fewer show stoppers on a daily basis. Next is going to be to implement some custom/complex controls to see how those translate to widgets. Something like:
Nice work Thorsten 
I note that you have a lot of watch functions in your code - are those really needed? I thought the idea of Vue was that you didn't need to manually watch things, it should process everything naturally itself?
Sometimes you have to help vue 
It deals with props and things you use in the template. And it deals with computed values, but they must have no side-effects. So for things that don't fit into those categories you have to do create a watcher explicitly.
In general I find that if I have a "pure" vue component the computed stuff is almost all I need. But if need to interface to plain JS stuff, like uPlot, then there are too many side-effects and other things happening and I need watchers. At the end of the day, everything translates to a watcher anyhow...
Something I don't know what to do about is documenting or describing how to fill charts with data from a database. What I have so far is an inject node that ticks every minute and kicks off a bunch of SQL queries to retrieve the data for the charts and send it to FlexDash. And there's a little feedback link when a new FlexDash instance connects to also send the data. It looks as follows:
A query function node looks as follows:
// function to truncate time in `column` to `seconds` intervals
function trunc_time(column, seconds) {
    return `floor(extract(epoch from ${column})/${seconds})*${seconds}`
}

const query = `
SELECT
    ${trunc_time("ts", 60)} AS time,
    location AS serie,
    avg(value) AS value
FROM wcc.measurements
WHERE
    ts >= NOW() - interval '12 hours' AND
    metric = 'humidity'
GROUP BY 1,2
ORDER BY 1,2
`

return { topic: "queries/humidity", payload: query };
Looking at the where clause, it fetches the last 12 hours from sensors that issue a humidity metric, and then outputs the data in 1-minute intervals. The "return" at the bottom has the topic for the topic tree, i.e. this is what the corresponding time-chart subscribes to. In the flow after the postgres node I have a pivot function that pivots the data so uPlot likes it and then off it goes to FlexDash.
Obviously here the time span is hard-coded to 12 hours, but it would be easy to have some time-span widget in FlexDash that sends a specific number of hours and then weave that into the query.
Problem with all this is that it's really specific to my database schema and to SQL, although the general idea can of course be implemented with any other time series database as well. What I'm wondering is what would be the best way to make this stuff accessible to more novice NR users?
Here comes attempt #1 at reproducing the heating controls panel... 
In the std dashboard it's a panel with a carefully arranged set of controls and looks as follows:
In the new dashboard I made a custom thermostat control and plopped three down, plus two ValueSequence widgets for day start/end. This is how it looks right now:
The nice part is that the template for the custom thermostat control is simple and just uses widgets:
<template>
  <div class="flex-grow-1 width100 d-flex flex-column justify-space-around align-center">
    <gauge v-bind="gaugeProps"></gauge>
    <value-sequence :range="set_range" :value="day_setpoint" :unit="unit"
                    label="— Day —" :label_above="true" style="font-size: 80%;">
    </value-sequence>
    <value-sequence :range="set_range" :value="night_setpoint" :unit="unit"
                    label="— Night —" :label_above="true" style="font-size: 80%;">
    </value-sequence>
    <div class="text-body-2 mb-1">{{active_label}}:
      <v-chip small>{{active?"ON":"OFF"}}</v-chip></div>
  </div>
</template>
The bad part is that the script part of the thermostat widget has a ton of stuff that doesn't really do anything but needs to be there to feed values through: 
export default {
  name: 'Thermostat',
  help: `Thermostat control with gauge and day/night setpoints.`,
  components: {Gauge, EditPlusMinus},

  props: {
    // for the gauge:
    unit: { type: String, default: "°F", tip: "unit shown after temperatures" },
    temperature: { default: null, dynamic: "$demo_random", tip: "temperature shown by gauge" },
    min: { type: Number, default: 50, tip: "minimum of gauge range" },
    max: { type: Number, default: 100, tip: "maximum of gauge range" },
    color: { type: String, default: "green", tip: "gauge color between low/high thresholds" },
    low_color: { type: String, default: "blue", tip: "gauge color below low threshold" },
    high_color: { type: String, default: "pink", tip: "gauge color above high threshold" },
    low_threshold: { type: Number, default: 62,
                     tip: "temperature for color change, null to disable" },
    high_threshold: { type: Number, default: 80,
                      tip: "temperature for color change, null to disable" },
    // for the setpoints
    day_setpoint: { type: Number, default: 70, tip: "target temperature during the day" },
    night_setpoint: { type: Number, default: 65, tip: "target temperature during the night" },
    setpoint_min: { type: Number, default: 60, tip: "minimum possible setpoint" },
    setpoint_max: { type: Number, default: 80, tip: "maximum possible setpoint" },
    // for the current state
    active: { type: Boolean, dynamic: "", tip: "appliance active boolean" },
    active_label: { type: String, default: "Heater", tip: "label next to active status" },
  },

  output: { default: null, tip: 'outputs setpoint as `{"day"|"night": value}`' },

  computed: {
    // put together all the props to pass down to the gauge widget
    gaugeProps() { return {
      min: this.min,
      max: this.max,
      value: this.temperature,
      color: this.gaugeColor,
      low_color: this.low_color,
      high_color: this.high_color,
      low_threshold: this.low_threshold,
      high_threshold: this.high_threshold,
      arc: 120,
      title: "",
      unit: this.unit,
    }},

    // range to pass into ValueSequence widget
    set_range() { return [this.setpoint_min, "...", this.setpoint_max] },
  },
}
My conclusion is that this is nice if one needs to build a compound widget that has some smarts on its own. Then it's great that one can plop down some existing widgets and focus on building some cool logic around them.
But this is a lot of noise just to lay out a bunch of widgets without extra logic. Thus FlexDash needs some notion of a panel after all...
I really like this approach. As well as the fun you seem to have with its development @tve
I concur. It is like watching a show on netflix. One episode each day
I can't wait for the last episode (when flexdash is released). Then the true fun will start.
Thanks @tve for doing this!
Copyright OpenJS Foundation and Node-RED contributors. All rights reserved. The OpenJS Foundation has registered trademarks and uses trademarks. For a list of trademarks of the OpenJS Foundation, please see our Trademark Policy and Trademark List. Trademarks and logos not indicated on the list of OpenJS Foundation trademarks are trademarks™ or registered® trademarks of their respective holders. Use of them does not imply any affiliation with or endorsement by them.
The OpenJS Foundation | Terms of Use | Privacy Policy | OpenJS Foundation Bylaws | Trademark Policy | Trademark List | Cookie Policy


 after some copy-paste-hack-hack I have a panel widget into which I can place other widgets! Now my latest heating controls look as follows:
