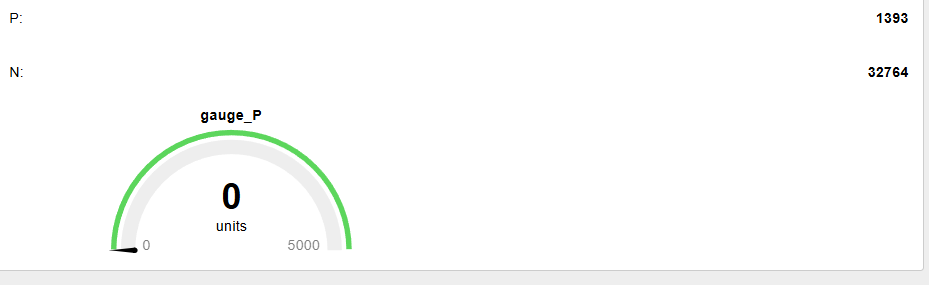
For some strange reason, i cannot activate display of data in it.
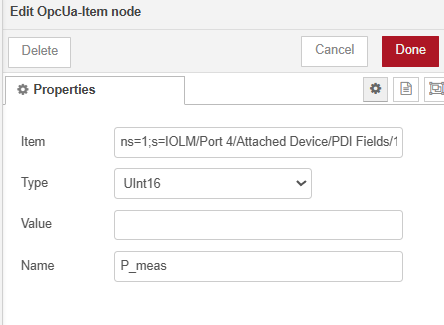
I’m receiving Uint16 data from OPC_UA and i’m able to display in it the Text box of Dashboard2.
But the gauge is always empty, i was trying different settings also with some basic json expresions, etc. But not success.At the moment the value is simpyl msg.payload.
On the other hand, on different flow im using simple gauge of boolean and it works.
It looks like the problem is in the data format or something, but im stuck already with it for long time.
Also I recommend watching this playlist: Node-RED Essentials. The videos are done by the developers of node-red. They're nice & short and to the point. You will understand a whole lot in about 1 hour. A small investment for a lot of gain.
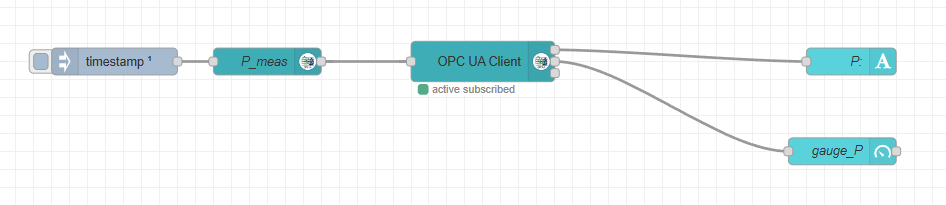
I don't know about the OPC node, but if your P node is showing the value that you also want to see in the gauge then I would have expected that output 1 of the OPC node would be connected to both the text node and the gauge.
Sorry, im completly new. i tought the 3 outputs of the OPC are parallel ( the same), you are right those are different outputs. And now if i connect to the first, gauge works.
thank you for your help !
that’s from OPC_client I tab
The second Output is for status monitoring purposes: allowing management of endpoints, their errors and statuses
Second Output shall look like this: '{error: {error} , endpoint: {opcuaEndpoint}, status: {currentStatus} }'
The third Output is for raw values returned from the OPC UA response