Hey to all, i try to store energy readings (kWh) from a power meter . Every 100 pulses is 1 kwh . I used counter node with range node and i have the correct number. I am feeding this noumber to influx db and then i make query from grafana and plot the readings to grafana. The problem i deal with is that in a reboot senario this incremental value(kwh) from counter node will be reseted . Any thought how i can achieve adding the last value (before the reboot) with the new incoming values with simplicity in order to have persistance to my readings? ps i dont want to make it through grafana with interval queries i want to achieve it through node red.
Instead of storing the total in the influx DB I would store the actual power consumption in the influx DB.
So within node-red you must every X (milli)seconds calculate the actual power consumption based on the counts at the start and the end of the interval period and store it in the influx DB.
When doing this calculation in node-red you must also check that the counter has not been reset. This can be easily checked by detecting if the new counter total is lower than the old one (unless your counter can go backwards - e.g. in case of Solar panels).
Hey janvda thanks for the responce . The way you described is achieved with a function node ? Since i do not know scripting is this possible by using a mix of standard nodes?
I have not checked the flow library for a node that is already covering most of the functionality.
You can do it also with a set of inject, change and switch nodes and using jsonata expression(s) in the change node(s). But I admit using jsonata instead of javascript in function node is still close to programming.
Have look at the watt2kwh contrib node - node-red-contrib-watt2kwh (node) - Node-RED
It may be easier just to reset the total each time you write it to influx, then you are storing the total usage since the last value was written. You can then use the SUM function in Influx to provide the total usage over any period, or CUMULATIVE_SUM if you want to chart the usage through the day, for example.
I don't think a conversion is necessary, I think @diaz_1988 already has a kWh figure.
Thanks to all .Colins suggestion to delete total after writing to influx fitted perfectly for the case . Thanks Colin.
Colin i think the total over a certain period of time can be also achieved with grafana .Through a drop down node in node red i ask grafana to display this values( e.g last hour last day last month etc ) and then the grafana chart is refreshed in node red dashboard showing the values for the period i asked for . This is called happiness 
Yes, as I said, using the influx SUM function.
Though I note from your first post that you didn't want to do this way, or did I misunderstand what you meant.
you mean that its possible to do the sum and cumulative sum functions through node red? that would be ideal. I will try it with influx db out node . Because using only grafana queries I do not have any msg.payload I only have the refreshed chart .
Sorry I don't know what you mean. A grafana chart is configured with a set of influx queries to run to fetch the data. It is nothing to do with node-red. In the query that you setup when you build the grafana dashboard you can setup whatever queries you like. Get what you want to see running in grafana first, then you can embed that in node-red if you want.
What do you mean by "reset" ? Do you mean that node-red is sending a command to the power meter device to reset its counter to 0 ?
@diaz_1988 is getting pulses from the meter and accumulating then himself, so he just needs to reset his counter each time.
flows (39).json (6.8 KB)
Colin sory for my english . Instead of reset the the influx db each time i send a 0 every sec. Thanks for the tip of reseting the total before send the next value. I am sure there are many alternatives that may give extra features but for my case it is just fine.
You said at the start
So I thought you were adding up pulses and then writing the total to the database every minute or something. I see I misunderstood, you were writing it every time it changes.
I see now you are just writing 0.01 to the database every time there is a pulse, which is ok. You don't need to reset anything because you are not adding up the pulses in node red. The injection of zero is not needed, you can delete it.
Ok thanks
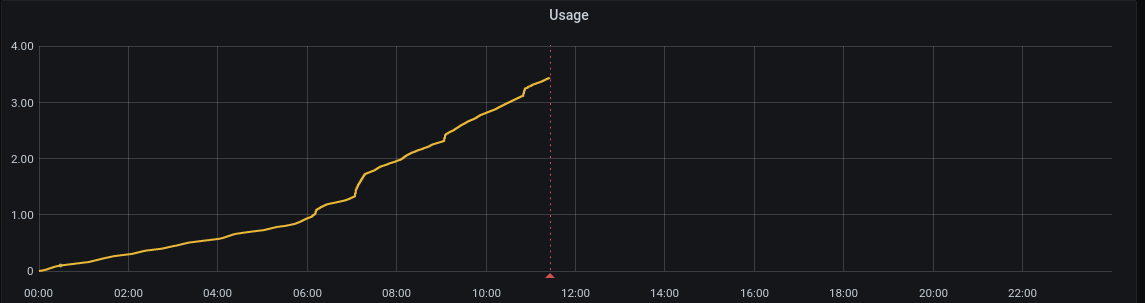
In case you need it, if you want to show the usage during a period, so you see an increasing value along the line as you use more, ending up with the total for the period at the right hand side, then you want a query something like this
SELECT CUMULATIVE_SUM(SUM("the_field")) FROM "the_measurement" WHERE $timeFilter GROUP BY time($__interval)
The SUM() tells it to add up all the samples in the interval covered by each pixel, then the CUMULATIVE_SUM tells it to add those up across the chart so it starts at zero at the left and at the right hand side of the graph will be the grand total for the period.
This is really nice. Can you suggest how to pass this query ? Is it possible to pass this query from inside node -red?