How to debug performance issues

For my home automation I have the following system.
HW: RPi 3
OS: Raspbian V11
Node-Red: v2.2.2
NodeRed Dashboard: v3.1.6

I started with my project years ago and builded it up step by step. In the beginning the system responded well below the 100ms mark, what allowed me to control some relays over MQTT that need to switch in a defined time frame for dimming some led spots.

Sins some months I got bigger performance issues and my led spots stopped to work correctly because the switching command for the relays can have delays up to 2-3s. Because I did many things in parallel at that time (not optimal, I know), I cannot tell exactly if it was a Node-Red update a new installed node or something I have programmed that caused this big performance problems. At that point I figured out that the RAM is over 90% "used", but the CPU use is most of the time very low. So my first steps were to uninstall InfluxDB that was in use for experimental stuff, then I uninstalled some extra nodes I had installed (TTS Nodes had a bigger negative impact on my performance) and because it was still not below 1s possible delay times, I reinstalled the full system on a new faster 64GB SD-Card and imported my flows again.

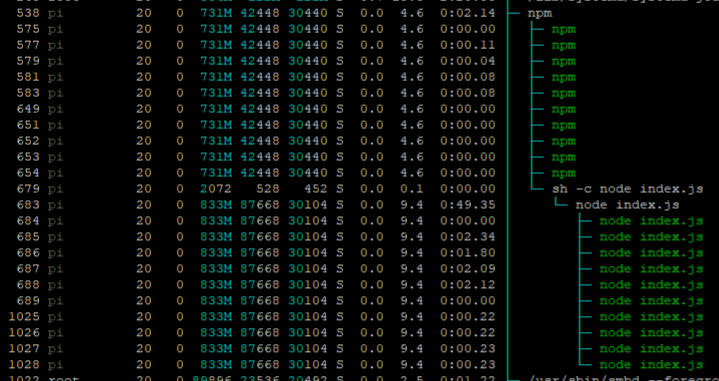
From the following thread I had learned how to interpret the RAM use correctly. In general my problem sounds similar to this one.

Now I have the situation that if my system is rebooted the performance is acceptable (~500ms delay’s) but as the RAM starts to fill up the performance goes down again to around 1s delay’s.


Somehow it looks like it has a connection to the RAM use. But still I believe that the RPi3 with 1GB RAM should be enough to run my project within 100ms response time. Do you have any Idea how I can debug such performance problems? How can I proceed to solve this problem?

It would be very helpful if we could see what needs how much RAM and what needs how long to process.

PS: RPi4 with more RAM is ordered, but as you may know… delivery time…

Are you using charts in the node-red dashboard? If so then how many lines in total across all charts, what data rate are you adding to the chart and what time range do the charts show?

Why are there so many node-red, node index.js and npm processes running? That doesn't look right and certainly nothing like my Debian server.

Also, that doesn't look memory bound at all. If it were, you would see much higher swp usage. The load average is also very low.

So at a guess, if you are seeing delayed reactions in node-red with those readings, something in node-red itself is slowing everything down.

But first you need to know why you've so many processes running I think.

I use 15 charts with each one line. Each chart is showing data for 24h. One is getting datapoints every 10s, most of them get data every 30s.

I use also many more gauges. But they do not store more datapoints then just the last one, so I guess they are not problematic as charts can be.

Kind of in the same direction. I do store the last message of all MQTT toppics in the global context. In my case there are arround 200 MQTT toppics used. Maybe not optimal but easy to handle for me and I know i should change it some day. For test use i deactivated this and restarted the system. After some houers I had still the same performance problems without storing mqtt messages.

hmm... actualy I don't know why I have many processes running and I was thinking that this has to be like this. So how can I find out more about this and how can I stop the not used processes?

My linux knowledge is pretty limited. So your input can be very helpfull to me. thanks.

Are you using exec nodes at all? Or something else that spawns additional processes?

Does the number of processes increase over time?

Are you saving the context to file?

There are 8640 10s intervals in 24h.

Your 10s chart will be trying to display 8640 points. Is your monitor an 8k display? If not this is utterly pointless and my money goes on the charts as a part of your problem.

To put it in another way, don't push more points to a chart than there are pixels in the display. E.g. If your chart width is 100 pixels then it is pointless sending more than 100 pixels to the chart.

1 Like

Further to @Steve-Mcl's post, I hope you are not running the browser on the Pi. If you are then don't.

Assuming you are not running a browser on the Pi, if you close down all browser windows on other machines, except one showing the editor (not the dashboard) does it make a difference?

1 Like

No I do not use exec nodes.

I will have a eye on the number of processes the next days and reboot the system.

No I do not save the context.

You could always analyse this in more depth using the node-red-contrib-process-resources node. This node allows to watch all OS processes or only the child-processes spawned by Node-RED...

You can change the display on htop to show a hierarchy which may help identify what is creating those running processes. Press F5 to see the tree view. Make sure you run htop as sudo sudo htop so you can see everything.

Something is also starting rngd as well which is a random number generator.

You are also running SAMBA and a Bluetooth service. If you don't need those, it would be better to stop and disable them.

@Steve-Mcl: Good point. I wanted to show the latest data fast to see changes quickly on the graph. But your point is for sure fully valid. Even more, it fixed my problem! Thank you. After deactivating all graphs my system works with the old and perfect speed. I will filter the data to a much lower volume in the future.

So I guess I have filled my RAM with pointless amount of data to a point where the system had to access the SD-Card very often.

--
For completeness I answer also to the other inputs, but as mentioned the problem seems to be solved.

@Colin: Numbers of processes are not increasing over time.

Pre Reboot:

Post Reboot:

@Colin: The browser is running on my laptop, not on the Pi. Switching lights has similar delays also without any browser online.

@TotallyInformation: All Screenshots are done now with sudo htop. The next one is with the tree-view, thank you for this tip's.

Samba I would like to use to exchange files. Bluetooth and random number generator I do not use. So I will try to deactivate them.

Tree-View:

That isn't the tree view. You can see that F5 will switch to tree view.

wrong picture uploaded... corrected...

OK, that seems to follow what Colin's comments that you are running something in your flows that is spawning shells.

What does "spawning shells" mean? Thank you for clearification. It looks like I should learn some linux basics ;-).

Like running other processes through the exec node. Also, some nodes spawn processes under the hood (e.g many python nodes simply fire up a python process in the background)

The point (I suspect) Julian was making is perhaps there is something spawning from your node-red that is eating up memory/CPU cycles. But since you have identified the excessive graphing to be your issue, it is less relevant now I guess.

1 Like

As Steve says. For example, uibuilder has a capability for installing npm packages. That is done using execa. Strictly speaking, a child process rather than a shell. The exec node is similar.

A shell is a command line using a "shell" such as BASH, ZSH or PowerShell or cmd.

The thing to note here is that whatever is creating those sub-processes doesn't seem to be tidying them up and is, instead, leaving them open. Whether that is a problem is debatable. Without knowing exactly what they are and why, probably not really possible to make a definitive judgement but it looks odd.

Never hurts. Though the concepts are exactly the same on Windows and MacOS as well :slight_smile:

@Steve-Mcl & @TotallyInformation
Thank you for your explanations.

Right now my performance is much better with reducing the graph data. Now I filter the data to a very low data-count (~30points per graph and 5 graphs active). But still over time (~24h) the performance goes down a little. By far not as bad as before, but still noticeable. So my motivation is still there to find also the last bit of problems for the responsiveness.

I have a lot of different nodes in use, some of them just because I was curious to test them. I will deactivate one by one the next days to figure out what could cause the bigger use of RAM.

How do you see on the htop output that there are many other processes? Then I can see quickly if deactivating a particular node helped.

actual situation

@BartButenaers Also I did not realy understand what to do with node-red-contrib-process-resources, but have to admit I should invest more time to this first.

This indicates that you have an npm process running that seems to be stuck since it is there in every post you've shared. You can see how the pi user has kicked off an npm command that has spawned many sub-processes that have not terminated. This is using up a very significant amount of memory (all-told around 15% of your memory).

Importantly, that shell command (sh ...) appears to have spawned multiple sub-processes itself, none of which have terminated even though none of them are actively doing anything (0% CPU).

So I would say that you definitely need to work out what is doing that and get rid of it.

On my server, I can see this:

If I go into an SSH command line, and do ps fx, I can see:

Which tells me that something in my profile or BASH rc file started a node script via npm. Or maybe not since I can't actually see myself what is running that. More investigation required :grimacing:

Ah ....

$ ps -eo pid,ppid,args | grep npm
 6968     1 npm start
10573  9835 grep --color=auto npm

$ ps -p 1
  PID TTY          TIME CMD
    1 ?        00:02:05 systemd

Tells me that the npm start was actually spawned by the process with ID=1 which is the system startup.

This is perhaps a more useful command:

$ ps -eo pid,ppid,state,comm | grep npm
 6968     1 S npm start

As it tells you the STATE of the process. For example, a state of Z would be a zombie.

Sadly, this doesn't tell us what systemd script actually created this. So yet more tracking required! Linux is a great server OS but once you leave the narrow path, you are dumped straight into the wildest jungle!


And one google later - bingo!

~$ sudo systemctl status 6968
[sudo] password for home:
â—Ź zigbee2mqtt.service - zigbee2mqtt
   Loaded: loaded (/etc/systemd/system/zigbee2mqtt.service; enabled; vendor preset: enabled)
   Active: active (running) since Wed 2022-07-06 17:49:38 BST; 1 day 17h ago
 Main PID: 6968 (npm start)
    Tasks: 23 (limit: 4915)
   Memory: 103.4M
   CGroup: /system.slice/zigbee2mqtt.service
           ├─6968 npm start
           ├─6979 sh -c node index.js
           └─6980 node index.js

Jul 08 10:52:27 home npm[6968]: Zigbee2MQTT:info  2022-07-08 10:52:27: MQTT publish: topic 'zigbee2mqtt/Ikea_PIR_01/device-type', payload 'EndDevice'
Jul 08 10:52:27 home npm[6968]: Zigbee2MQTT:info  2022-07-08 10:52:27: MQTT publish: topic 'zigbee2mqtt/Ikea_PIR_01/device-manufacturerID', payload '4476'
Jul 08 10:52:27 home npm[6968]: Zigbee2MQTT:info  2022-07-08 10:52:27: MQTT publish: topic 'zigbee2mqtt/Ikea_PIR_01/device-manufacturerName', payload 'IKEA of Sweden'
Jul 08 10:52:27 home npm[6968]: Zigbee2MQTT:info  2022-07-08 10:52:27: MQTT publish: topic 'zigbee2mqtt/Ikea_PIR_01/device-powerSource', payload 'Battery'
Jul 08 10:52:27 home npm[6968]: Zigbee2MQTT:info  2022-07-08 10:52:27: MQTT publish: topic 'zigbee2mqtt/Ikea_PIR_01/device-applicationVersion', payload '32'
Jul 08 10:52:27 home npm[6968]: Zigbee2MQTT:info  2022-07-08 10:52:27: MQTT publish: topic 'zigbee2mqtt/Ikea_PIR_01/device-stackVersion', payload '98'
Jul 08 10:52:27 home npm[6968]: Zigbee2MQTT:info  2022-07-08 10:52:27: MQTT publish: topic 'zigbee2mqtt/Ikea_PIR_01/device-zclVersion', payload '3'
Jul 08 10:52:27 home npm[6968]: Zigbee2MQTT:info  2022-07-08 10:52:27: MQTT publish: topic 'zigbee2mqtt/Ikea_PIR_01/device-hardwareVersion', payload '1'
Jul 08 10:52:27 home npm[6968]: Zigbee2MQTT:info  2022-07-08 10:52:27: MQTT publish: topic 'zigbee2mqtt/Ikea_PIR_01/device-dateCode', payload '20190308'
Jul 08 10:52:27 home npm[6968]: Zigbee2MQTT:info  2022-07-08 10:52:27: MQTT publish: topic 'zigbee2mqtt/Ikea_PIR_01/device-softwareBuildID', payload '2.0.022'

So sudo systemctl status [pid] gives the answer as to what spawned that npm command.